Sustainability Scores
What you'll do
Use Sustainability Scores to quickly understand how well a portfolio company addresses its material sustainability topics, based on what is evidenced in its submitted sustainability report. You'll be able to:
- see which topics are in scope for each company (material topics),
- compare scores across companies, and
- open any score to view the dimension breakdown and the AI rationale behind it.
Principles
Our scoring approach is designed to be:
- Objective and consistent: Uses stable scoring rules to keep results comparable across companies and reporting cycles.
- Company-aware: Differentiates between company types by scoring only the topics that are material to that company.
- Hard to game: Encourages evidence-based reporting and reduces the risk of greenwashing.
- Transparent: Each score can be opened to see how it was calculated and what would improve it.
Step 1: Define scope per company
The process starts with an automated mini-DMA. This identifies which of the 10 ESRS topics are material for the company.
- The automatically selected topics are shown to the company.
- The company can add extra ESRS topics if needed.
- The company cannot remove any topics that were automatically identified as material.
ESRS topics
- Climate change
- Pollution
- Water and marine resources
- Biodiversity and ecosystems
- Resource use and circular economy
- Own workforce
- Workers in the value chain
- Affected communities
- Consumers and end-users
- Business conduct
Each topic in scope becomes one Sustainability Score on the company's Sustainability Dashboard.
How material topics are selected (in short)
Karomia assesses the company's activities and maps them to one or more industries. Each industry has a fixed set of material subtopics. Karomia then evaluates the specific company against the material subtopics of the sector(s) they belong to.
The result is presented in a materiality matrix inside your Sustainability Dashboard. There you'll find the automatically calculated materiality results for each of the subtopics as well as a rationale explaining the industry baseline vs the specific company's context.
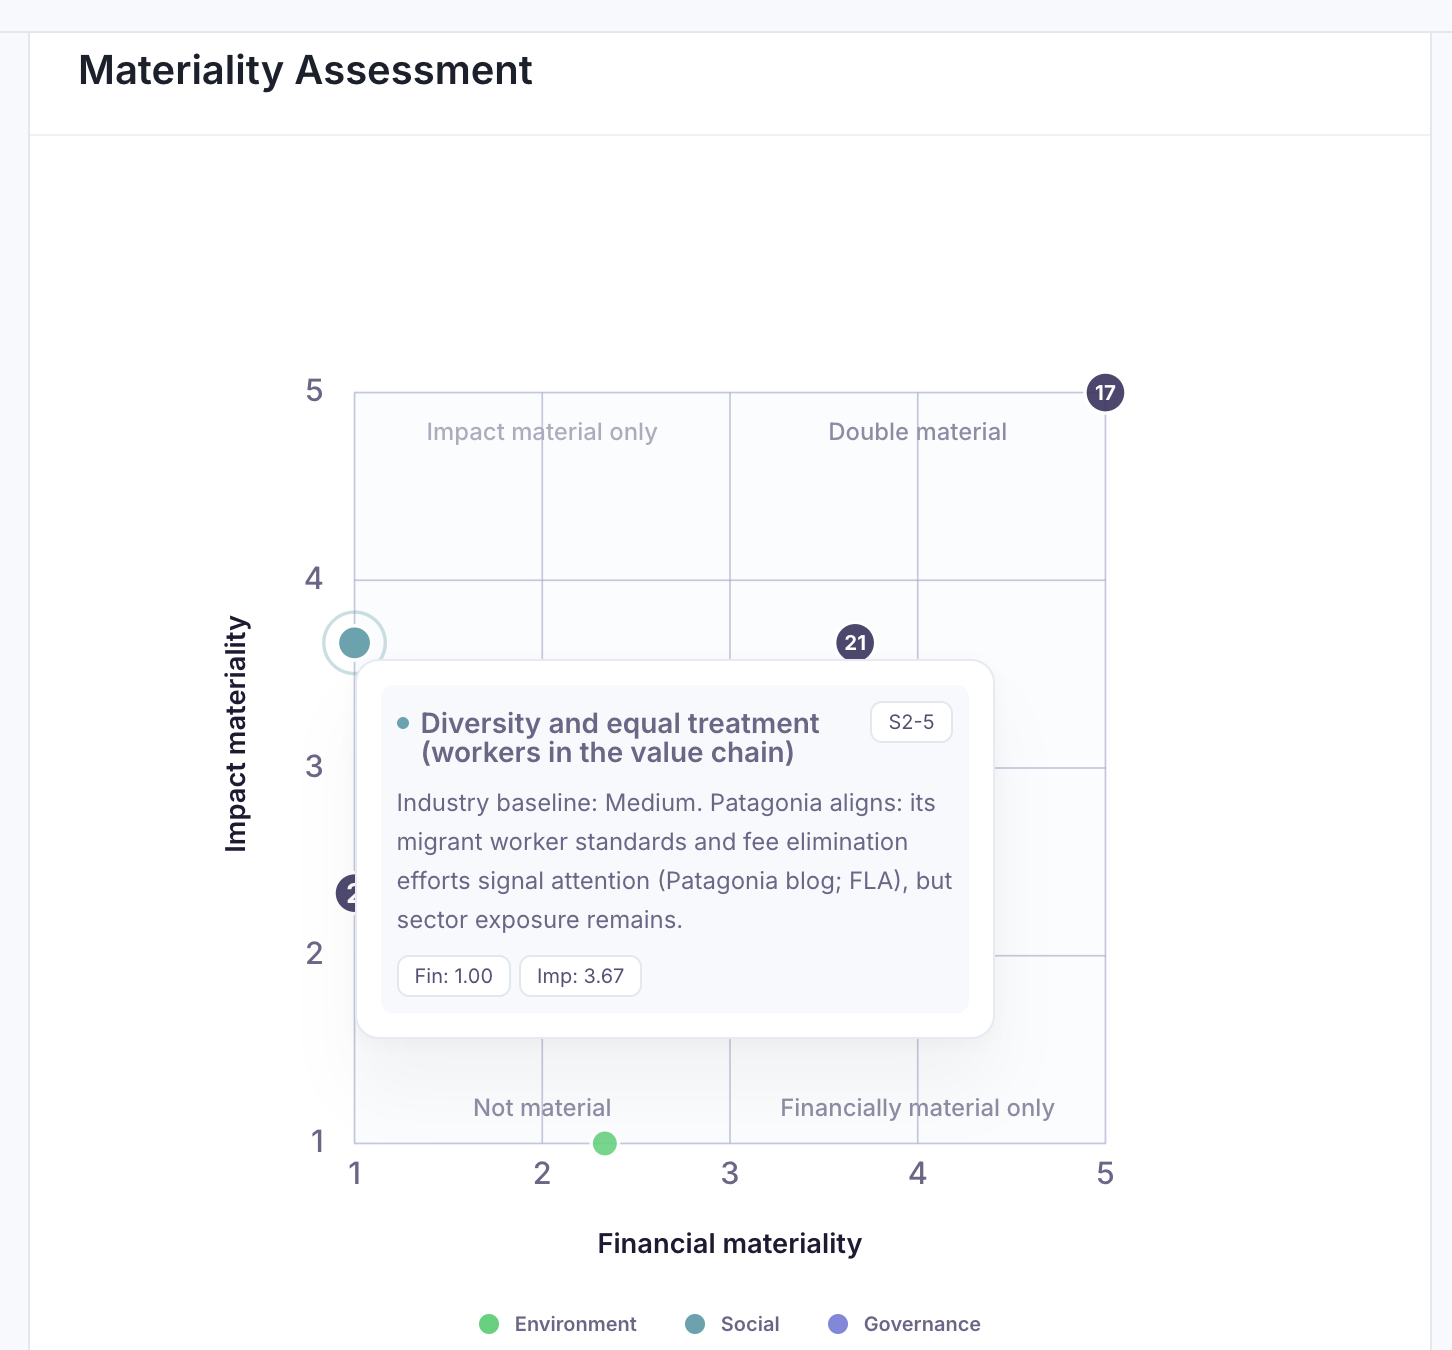
All subtopics with at least one score of 3 or higher are considered 'material'. As soon as one subtopic is material, the topic it is linked to also becomes material.
Only material topics are included in the sustainability scores. If desired for a specific company, you can always include additional topic scores for topics that were found to not be material.
Step 2: Calculate scores
As soon as a company completes their sustainability report, Karomia automatically calculates all sustainability scores.
Each score is made up of two or more dimensions. Each dimension is scored on a 0–3 scale, based on evidence in the company's submitted and shared ESG assessment. Each score, in turn, has a factual, verbal description — a set of criteria that need to be met in the sustainability report for the company to achieve that score.
Karomia AI assigns the highest justified score for each dimension and generates a rationale explaining why that score applies and why a higher score was not attained, referencing the underlying sustainability report.
Step 3: Aggregate scores
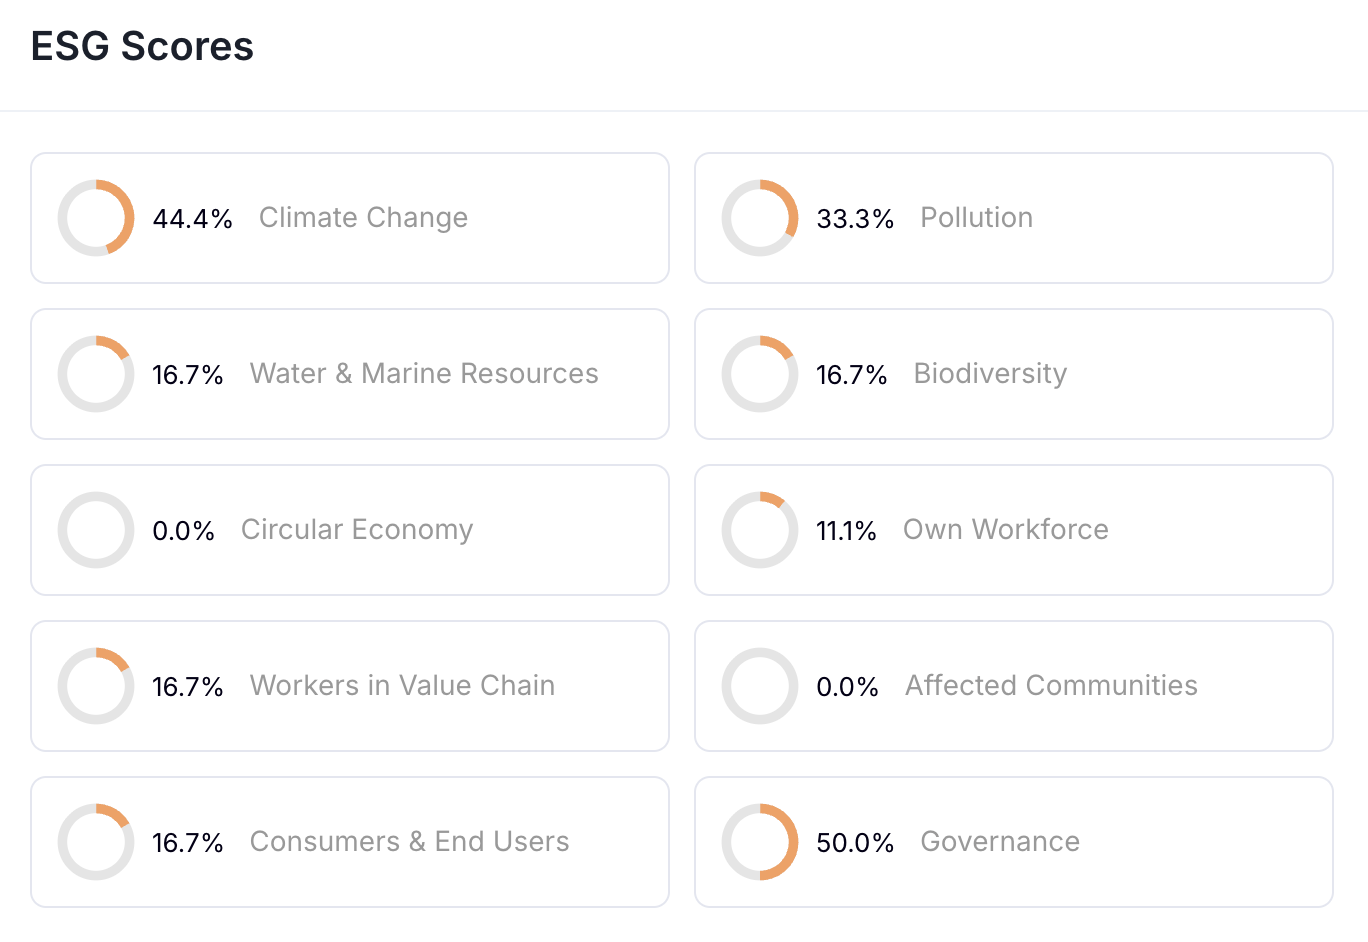
A topic score (e.g. for Climate change) represents the average across its underlying dimensions and is presented as a percentage (0–100%).
An example:
| Scope | Score | Calculation |
|---|---|---|
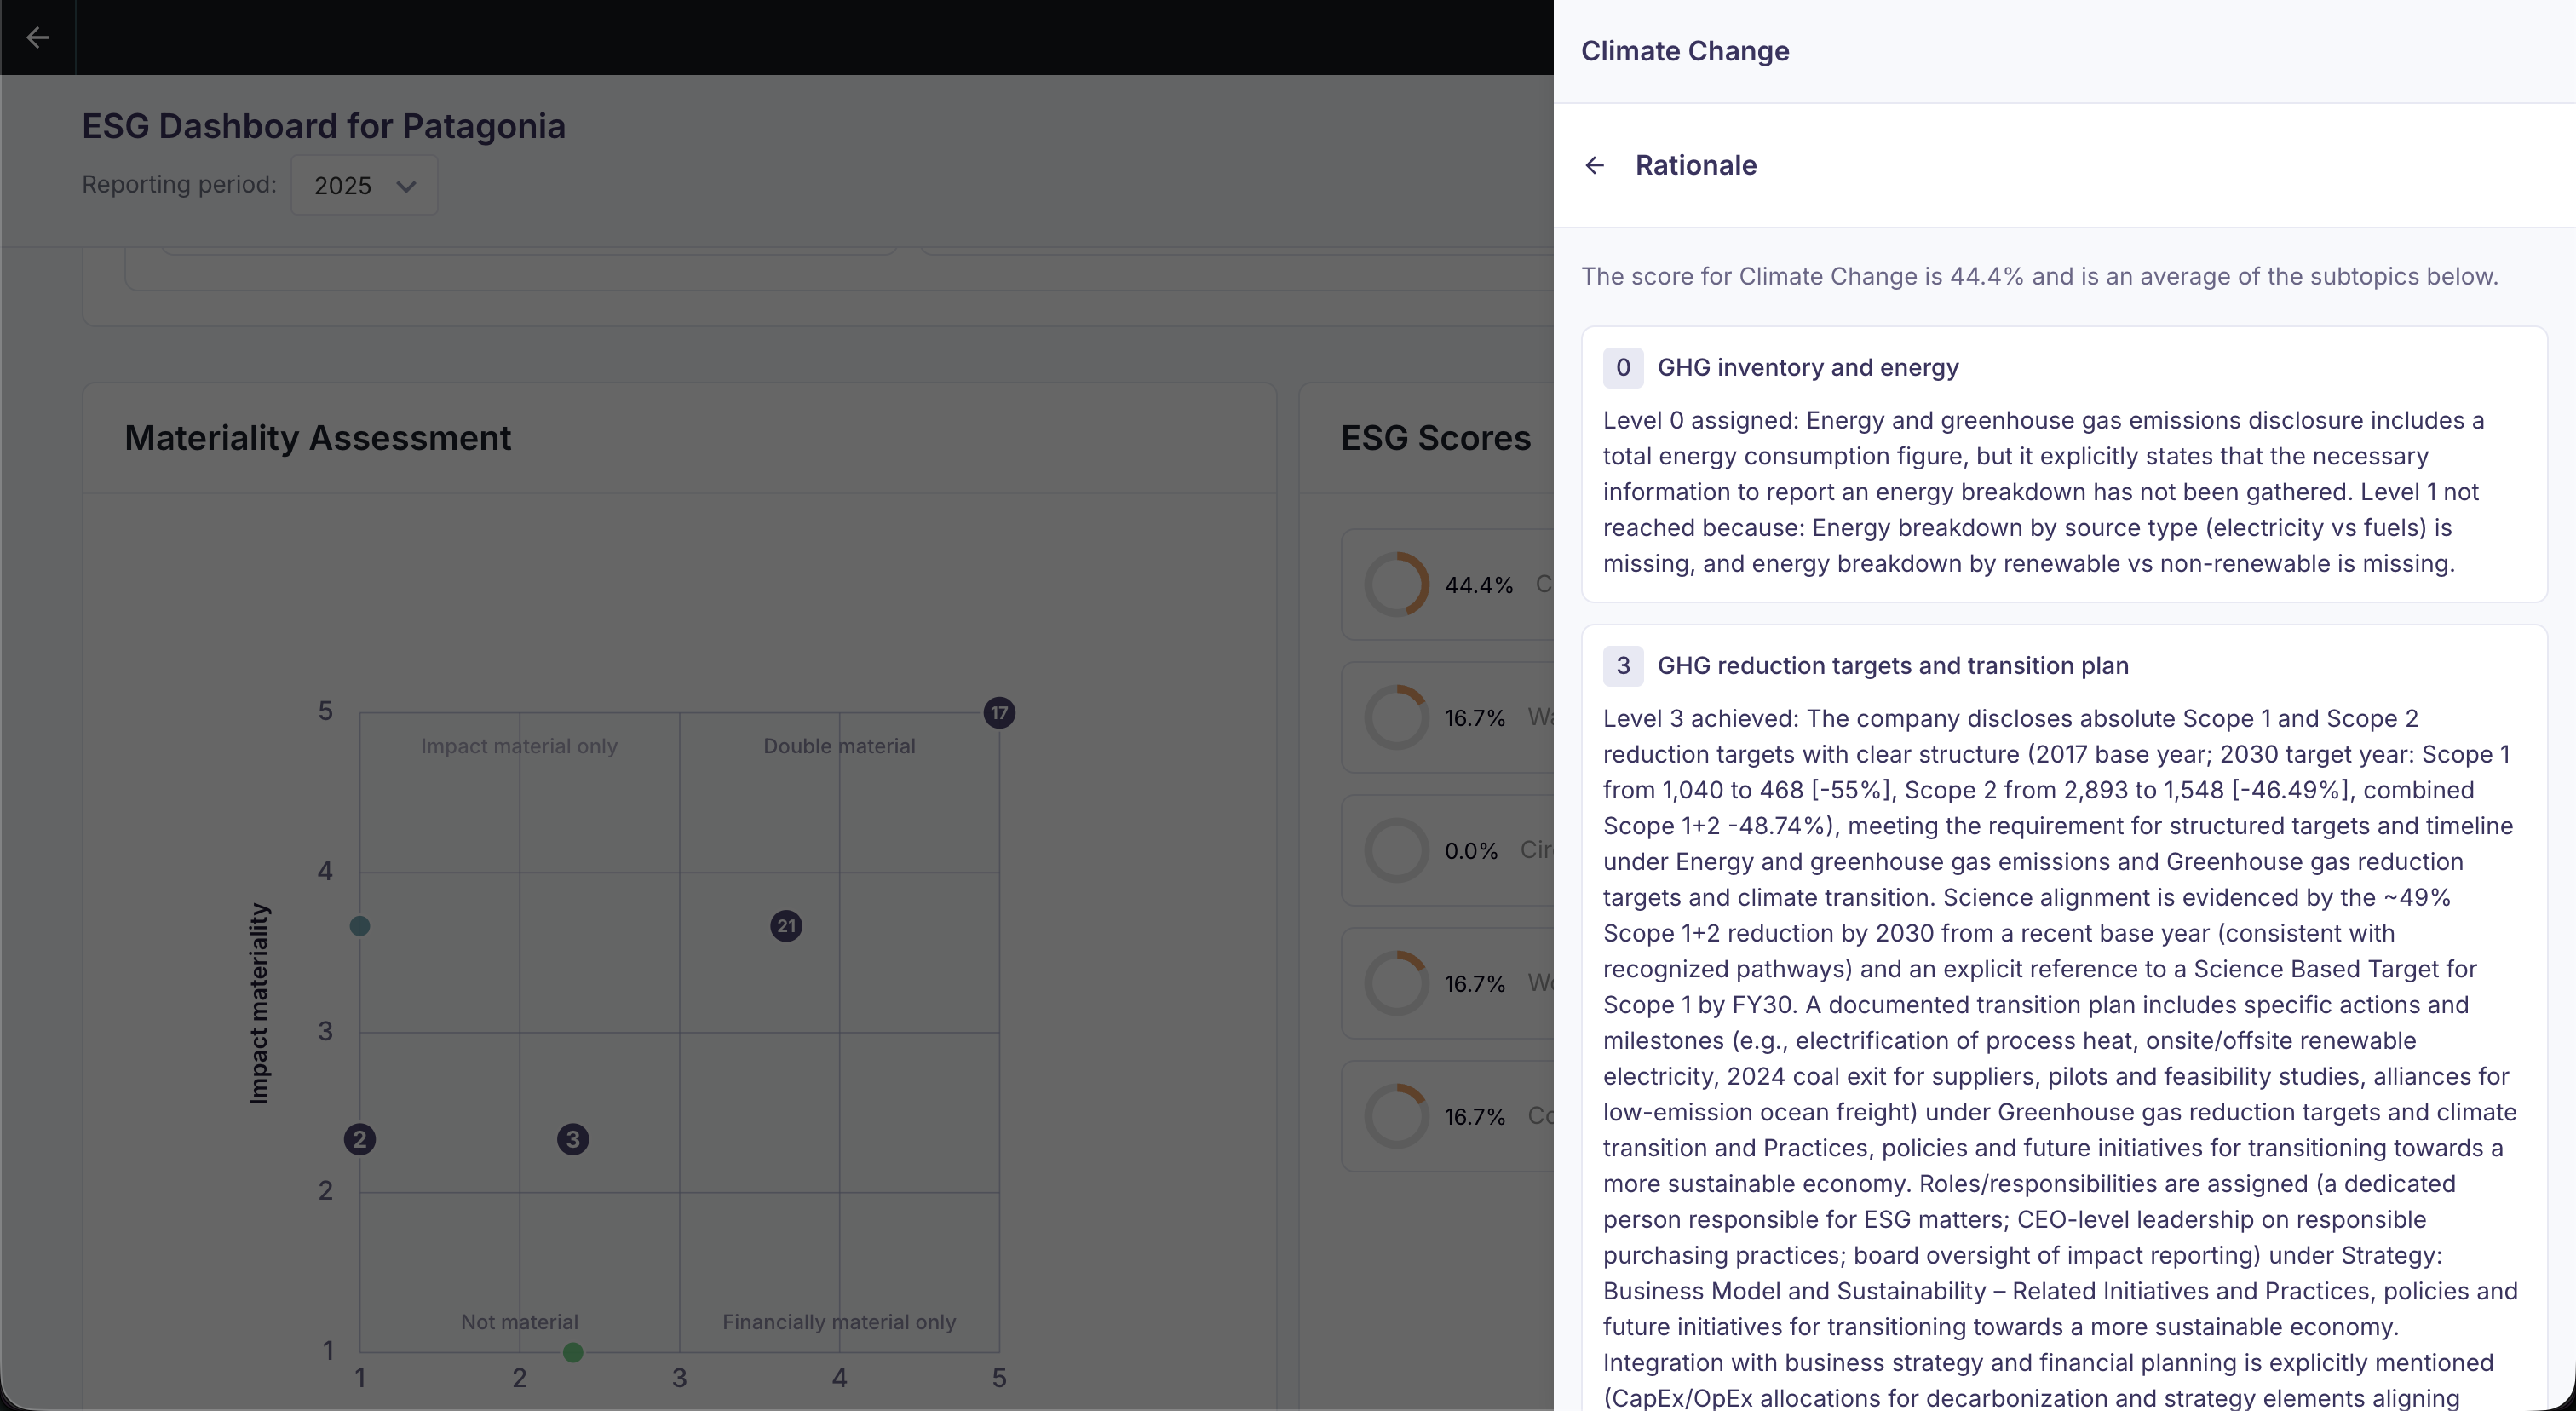
| Topic: Climate change | 44.4% | Average of underlying dimension scores: (0+3+1)/3 = 1.33. 1.33 on max score of 3 = 44.4% |
| Dimension: GHG inventory and energy | 0 | |
| Dimension: GHG reduction targets and transition plan | 3 | |
| Dimension: Climate risks and adaptation | 1 |
Topic scores are aggregated into category scores: Environmental, Social, Governance. Each of them is again the average of the underlying topic scores that are included in the dashboard for a given company.
These 3 category scores are, in turn, averaged into a single overall score.
Step 4: View scores in dashboard
Company view (deep dive)
In the Sustainability Dashboard, you can open any score to see:
- the topic's dimension breakdown, and
- the rationale per dimension (what evidence supports the score and what would raise it).
Aggregated view (portfolio)
In aggregated mode, you can see:
- average topic scores across companies with calculated scores, and
- an overview of completeness (who submitted their report and who didn't yet).