Sustainability Dashboard
Your sustainability dashboard consists of 3 main sections:
- Sustainability Metrics
- Materiality Assessment
- Sustainability Scores
The first section is covered in this article, while 2 & 3 are covered in Sustainability scores.
What you'll do
Use the Sustainability Dashboard to:
- find the Metrics you care about (by topic, SDG, and reporting year),
- compare performance across companies (aggregated view) or focus on a single company,
- drill into a Metric to see details and completeness,
- track year-over-year changes and (where available) progress against targets.
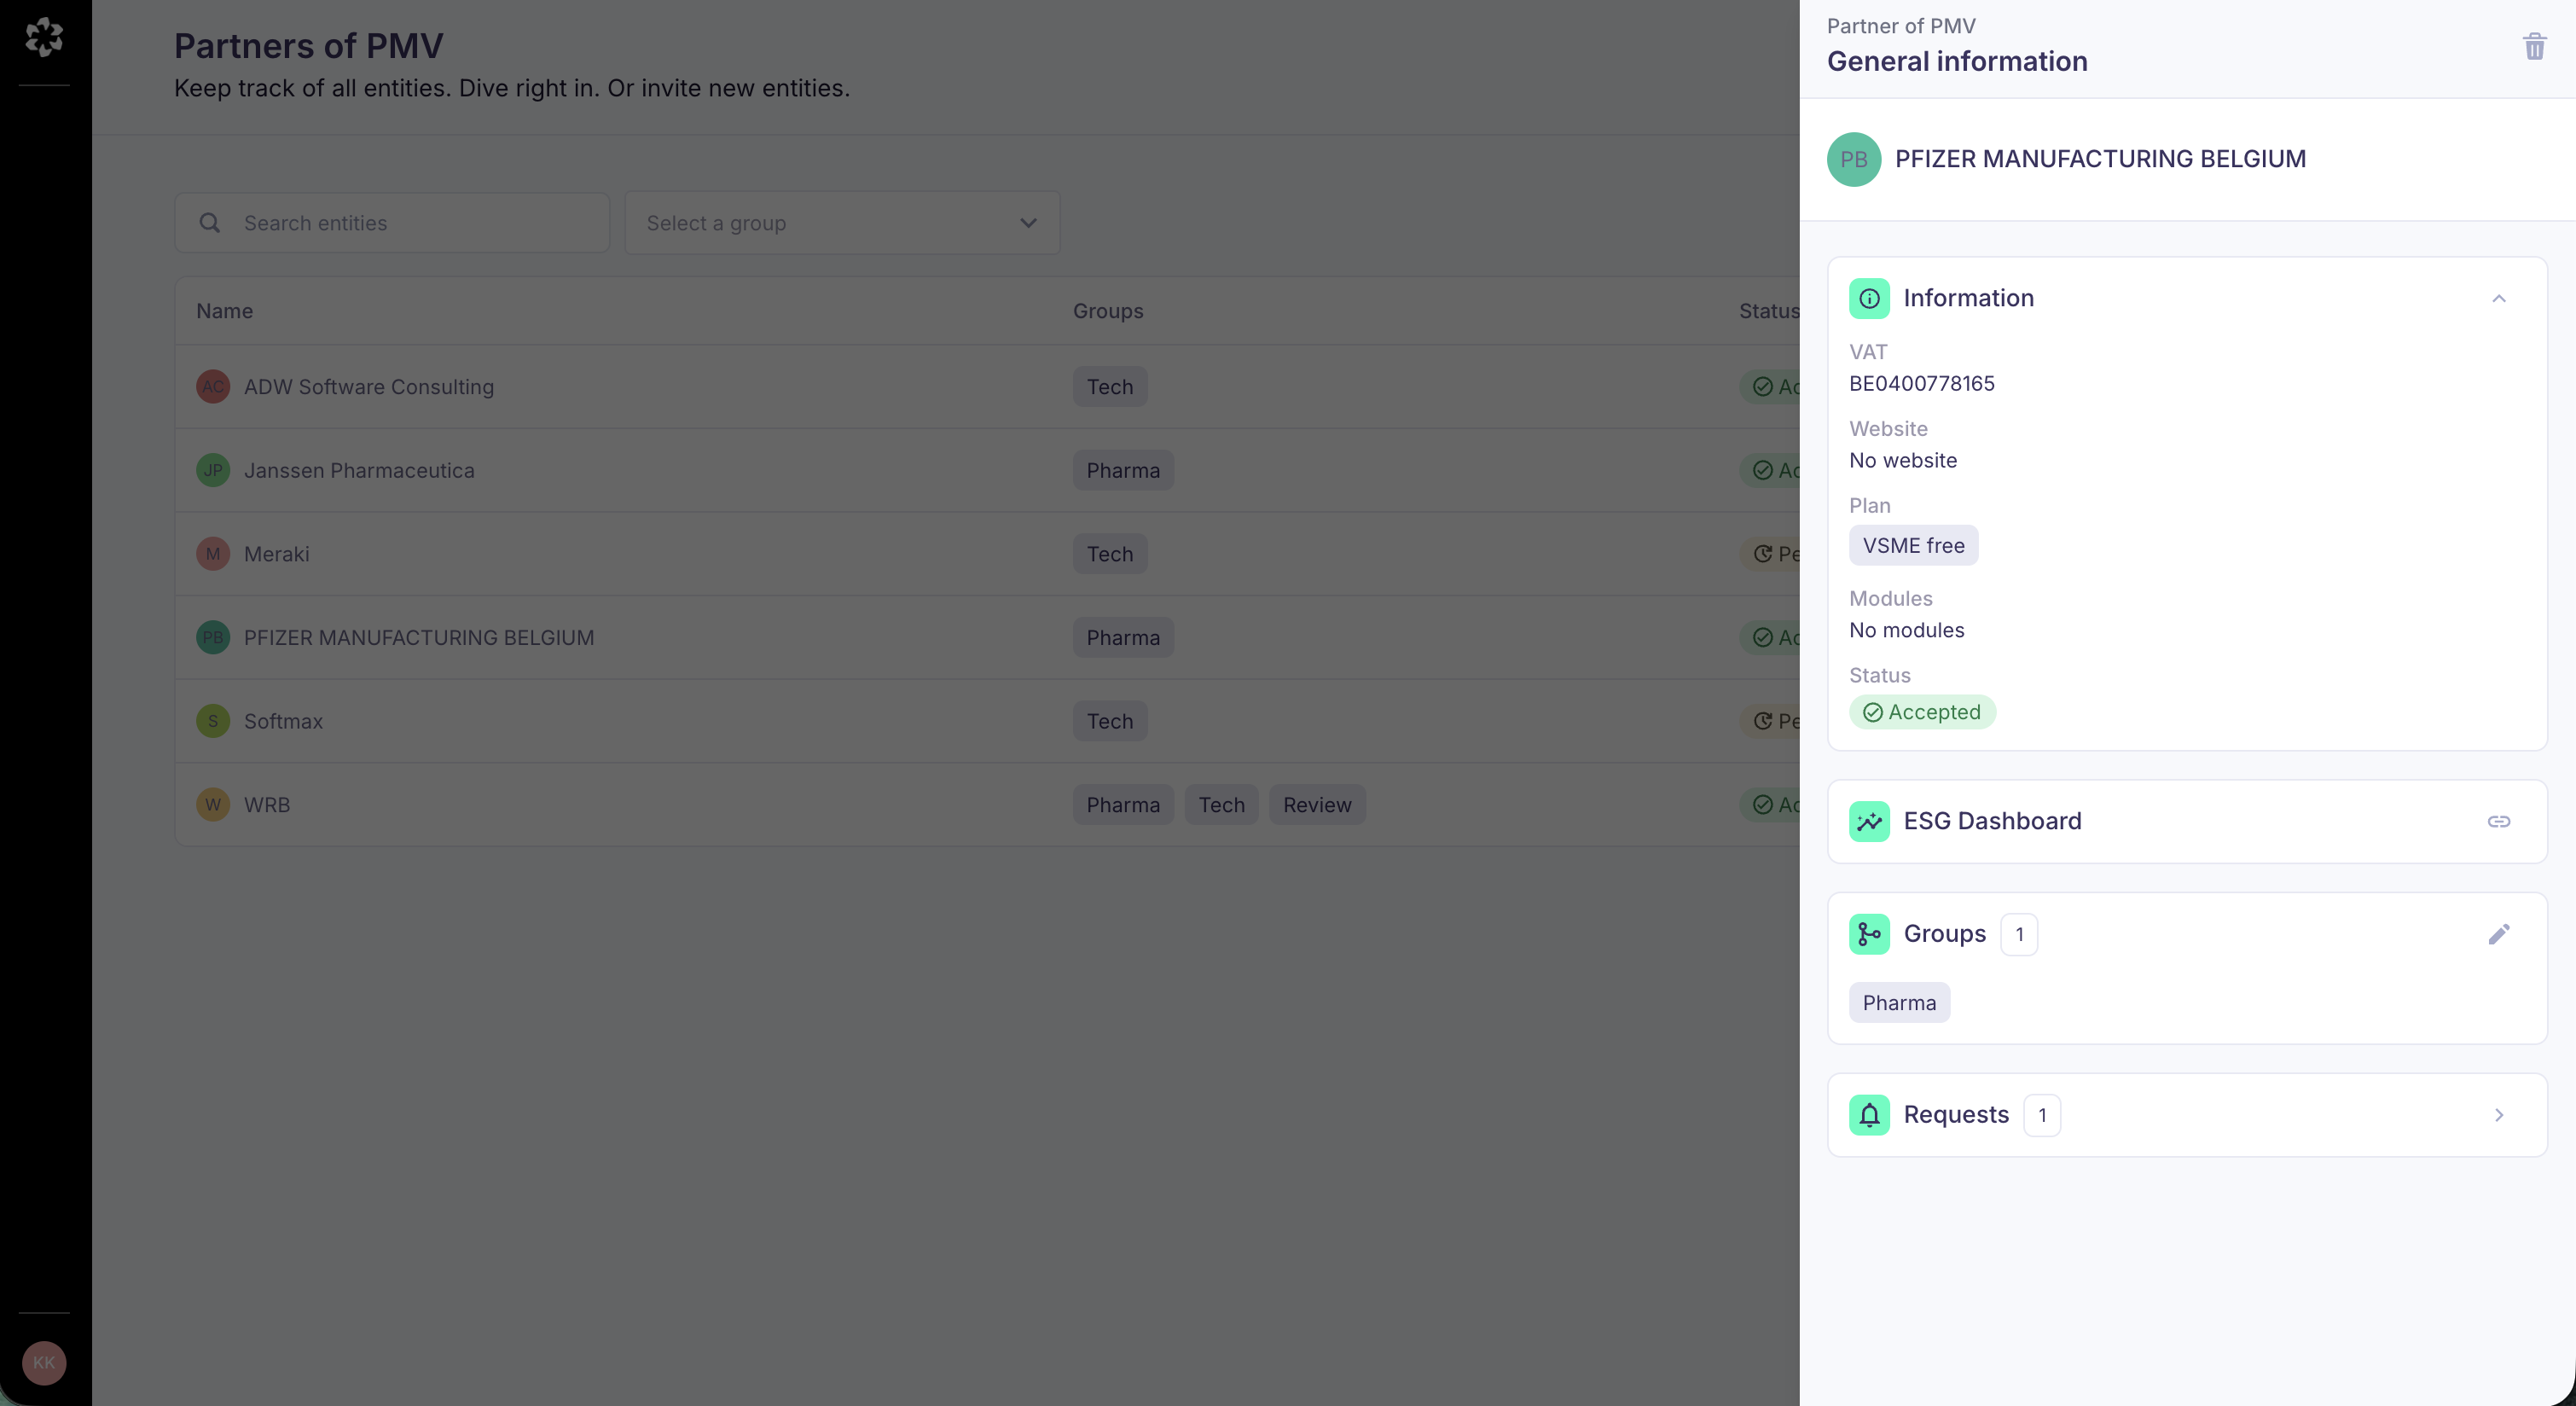
Step 1: Review Metrics
To access the dashboard of a given company, go to your company page, click on the company you're interested in, and click on 'ESG dashboard'.
This link only becomes visible when the status is set to 'Accepted'. The status is set to 'Accepted' when:
- the company completed the report and their legal representative validated the results, and
- they consented to sharing their data with you.
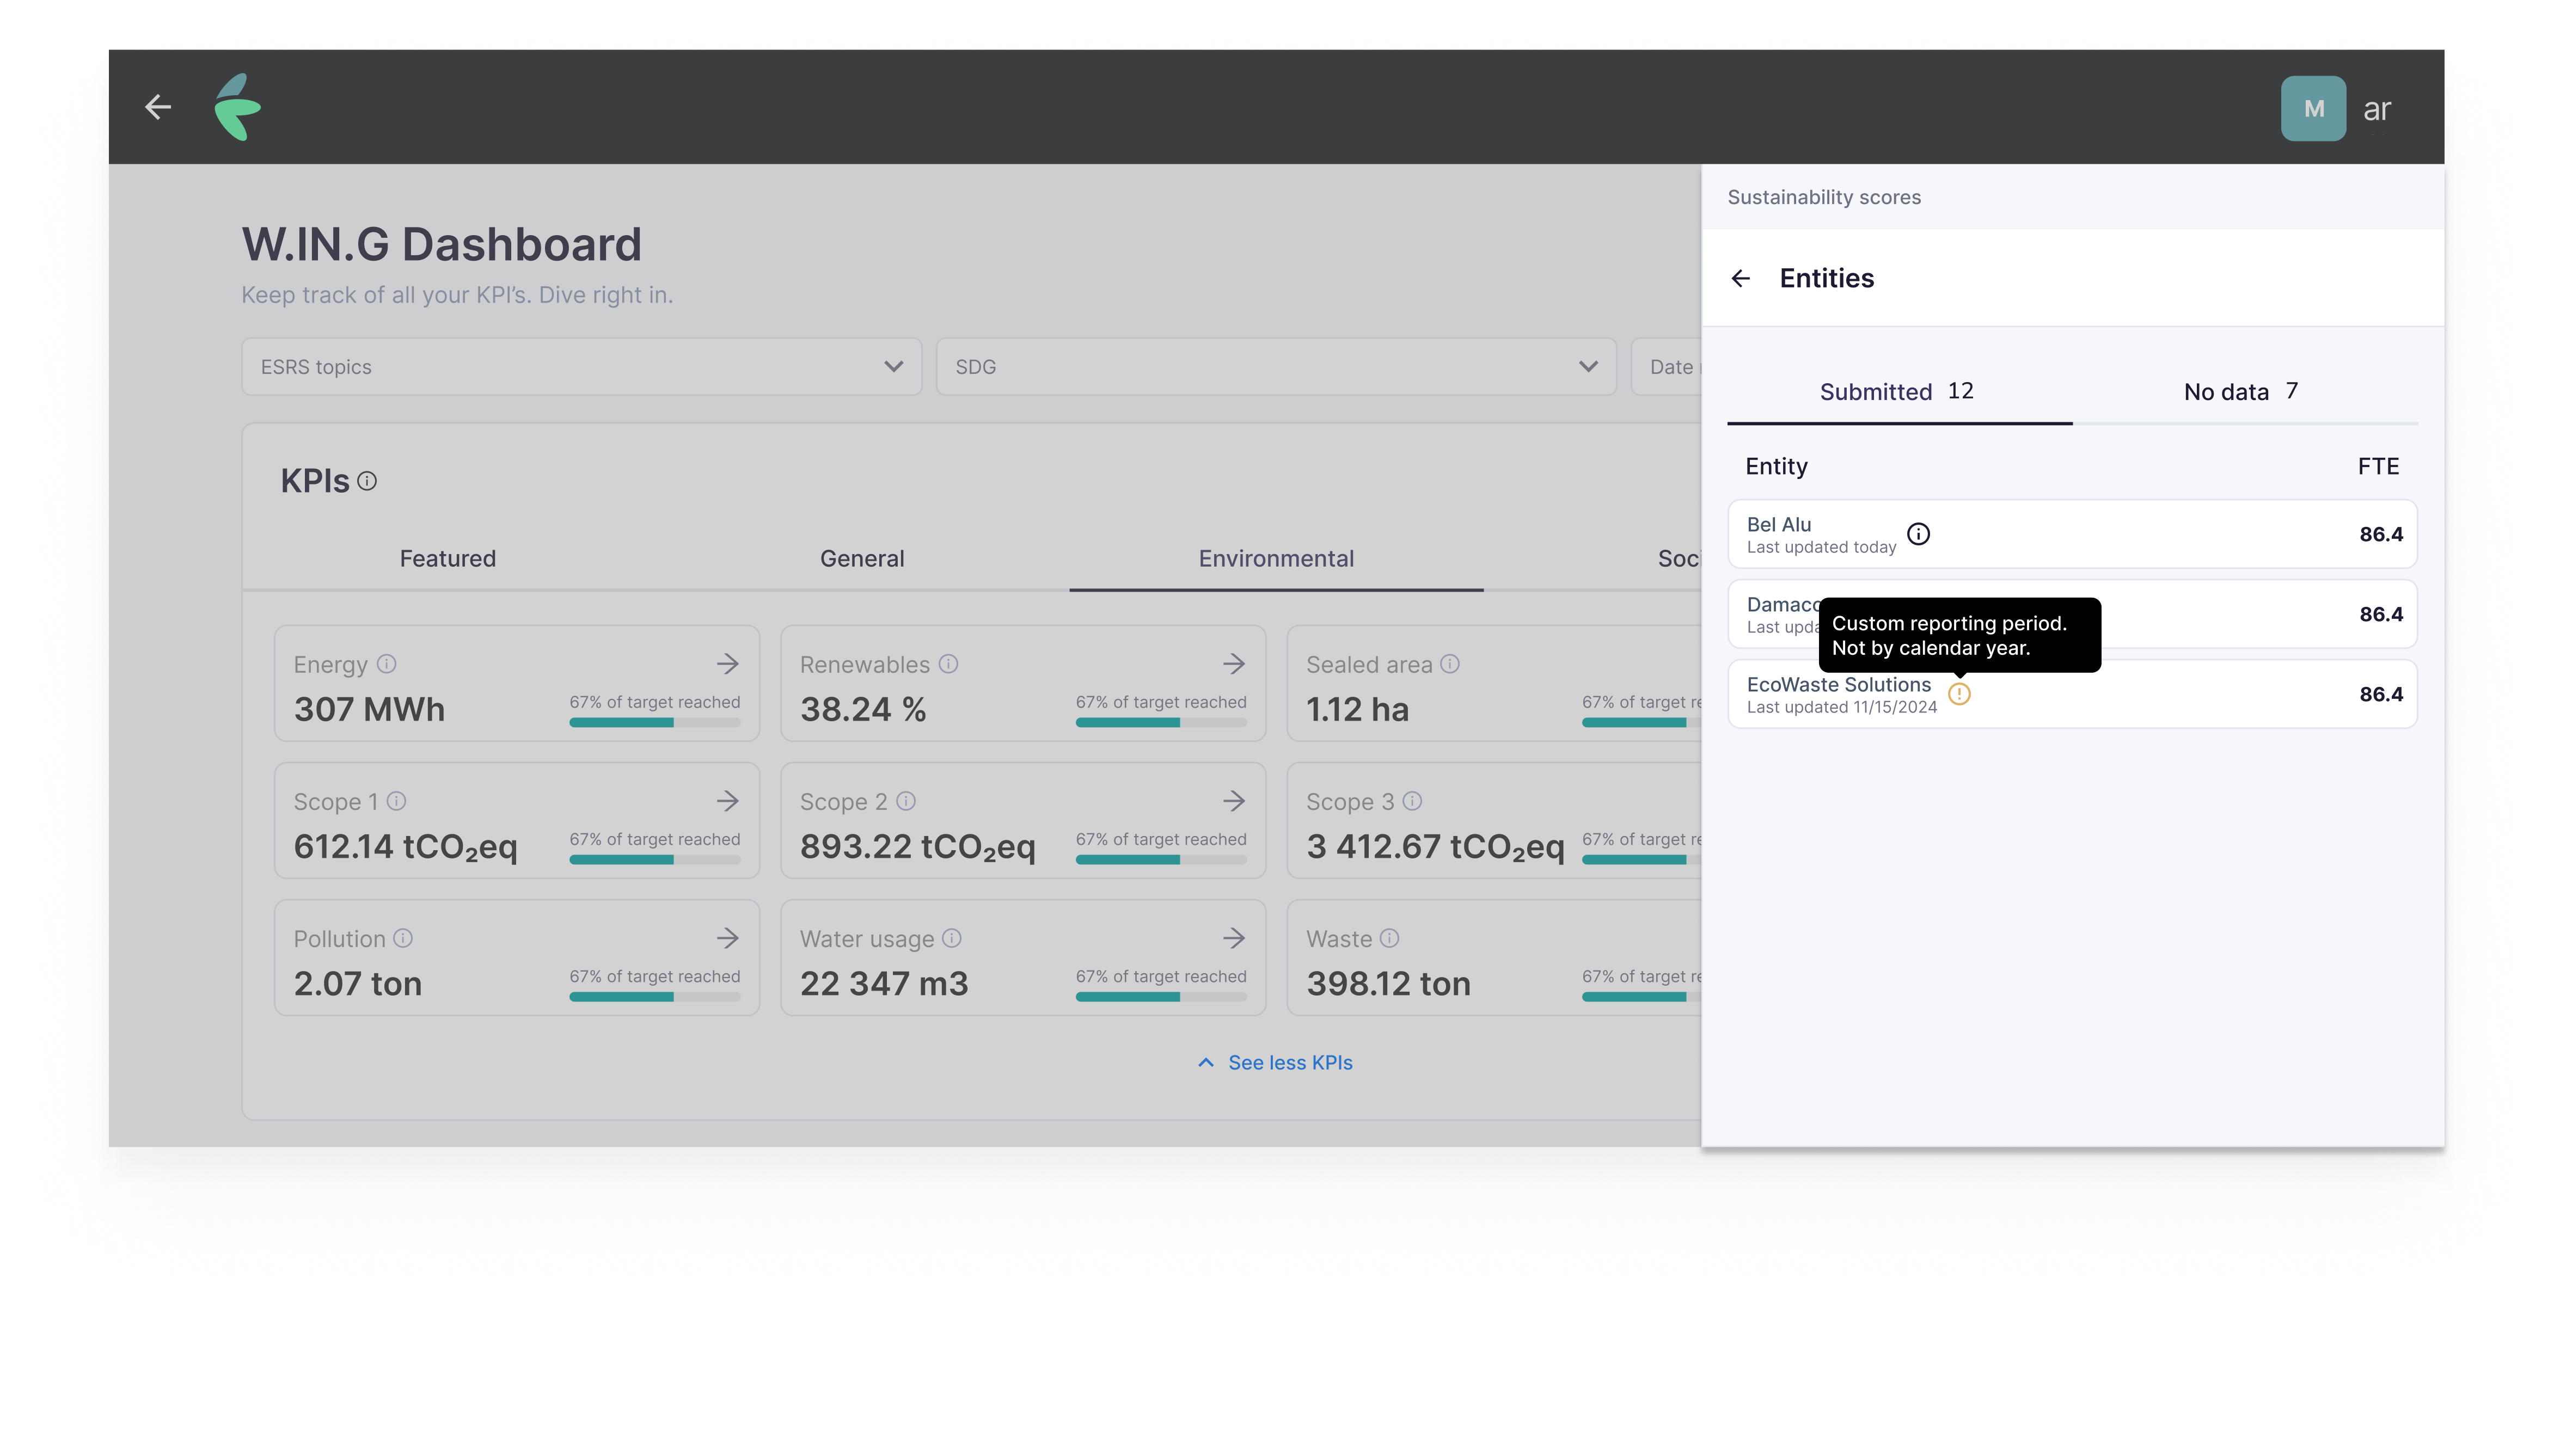
How to find the Metrics you need
You can locate Metrics quickly in three ways:
- Filters — Filter by (ESRS) topic, SDG, and reporting year to narrow down the dashboard to what matters for your review.
- Tabs — Metrics are grouped into tabs: a first tab with the Metrics most relevant for you, and separate tabs organised by Environmental, Social, Governance and Financial for deeper review.
- See more / see less — When a tab houses more than 12 Metrics, some Metrics will be hidden. Use 'See more' to expand the full list whenever you need it.
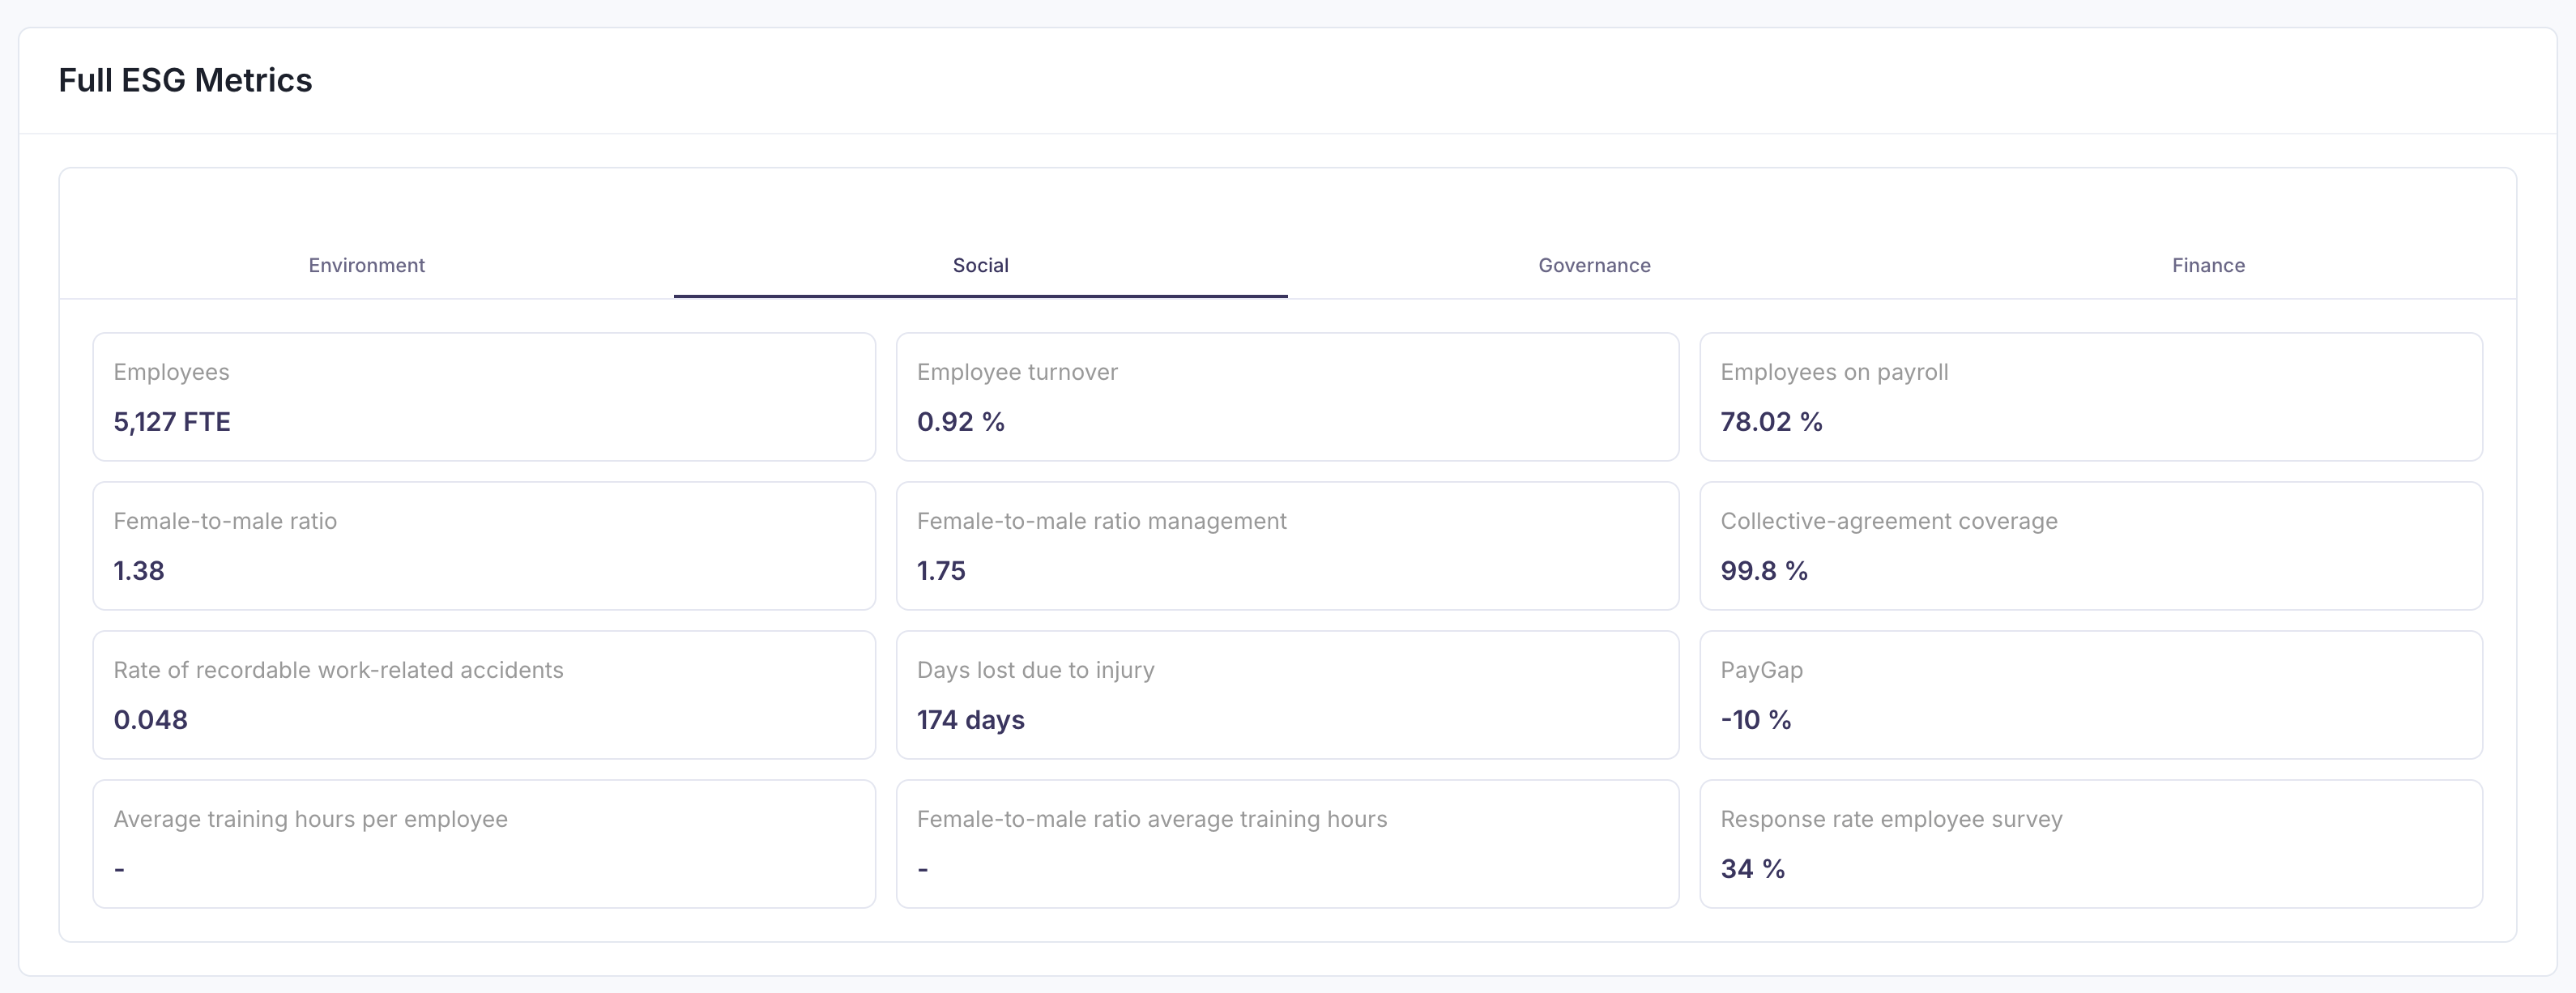
Understanding a Metric card
Each Metric card shows the company's reported value for the reporting period you are viewing.
Click a Metric card to open its detail view, see year-over-year progress and set targets.
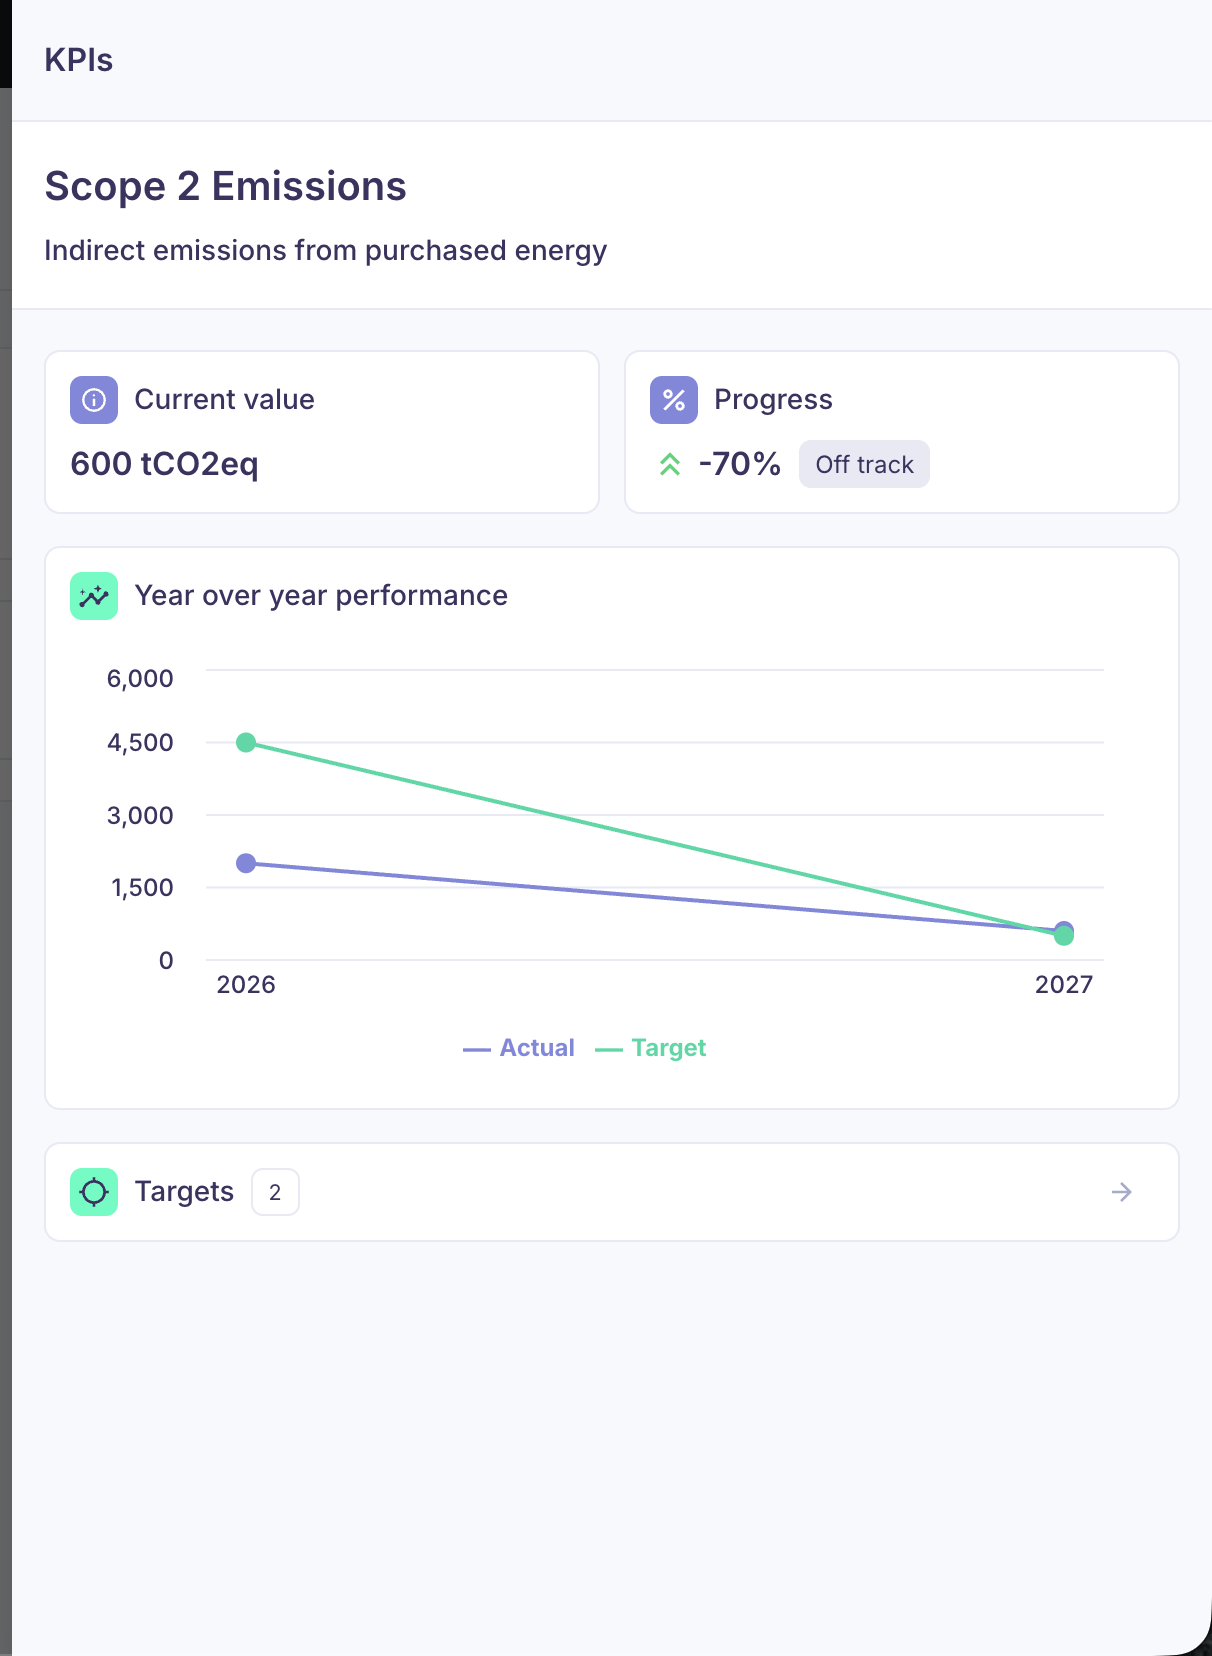
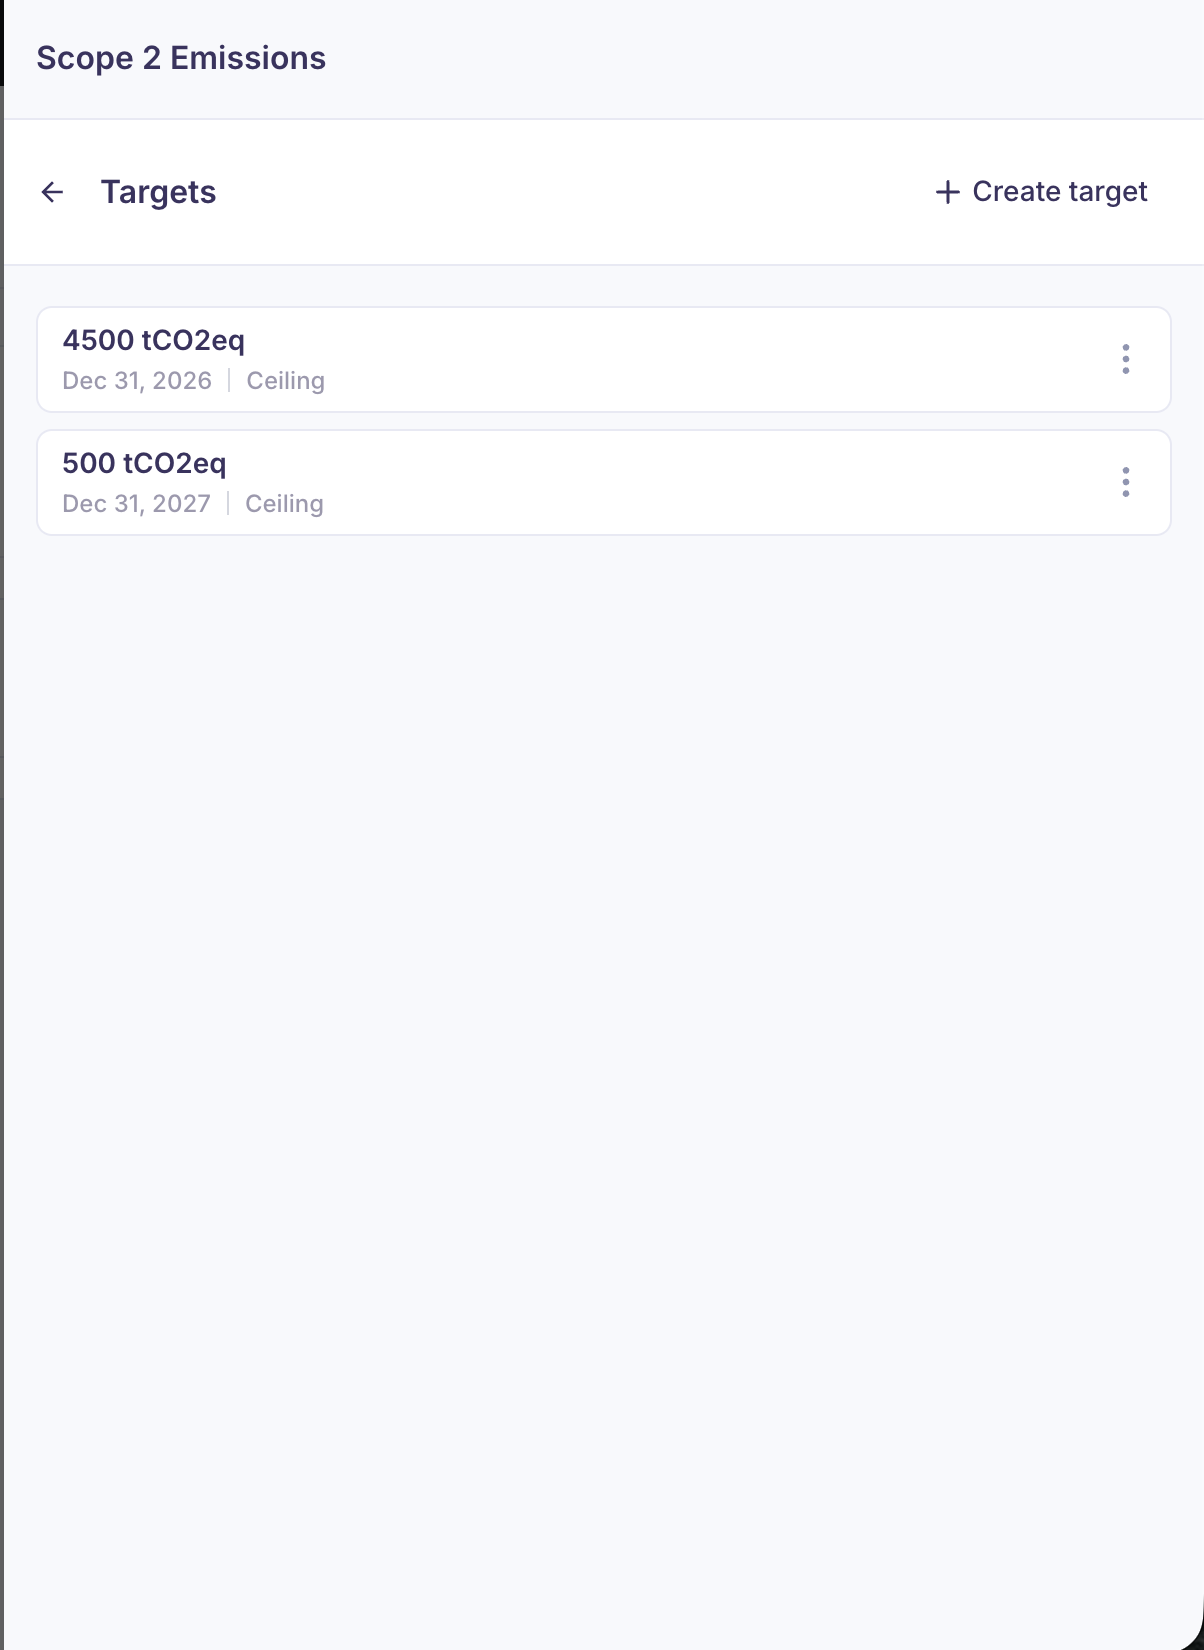
Step 2: Set targets
When relevant, you can set a target for any given Metric or Sustainability score at the individual company level. Targets are visible only to you and your colleagues and not to the portfolio company.
To set a target, click on the respective Metric or Score card to open its detail view. In there, you'll be able to set or edit targets.
Two target types are available:
- Floor target (minimum acceptable value): Set a lower bound that the company should not fall below. Use this for Metrics where higher is better (e.g., % women in management, % renewable energy use).
- Ceiling target (maximum acceptable value): Set an upper bound that the company should not exceed. Use this for Metrics where lower is better (e.g., CO₂ emissions intensity, waste per unit, water consumption).
Examples:
- Floor target: "By end of 2025, female representation in management must be at least 30%" (lower limit — you want them to stay at or above this).
- Ceiling target: "By end of 2025, GHG emissions intensity must not exceed 5 tonnes CO₂e per €1M revenue" (upper limit — you want them to stay at or below this).
Aggregated dashboard (portfolio view)
When you navigate to the 'Dashboard' page within the 'Partner' navigation menu, you land on the aggregated view. The aggregated values reflect an average across companies:
- that you have access to (based on groups), and
- that have already submitted and shared ESG data for the reporting period you selected.
Filter down to a group
From the aggregated view, you can filter to see a specific group (e.g., fund/team).
What's different when viewing multiple companies
- Metric and score values represent an average across companies, and
- Targets and materiality assessment are not shown as they are only relevant for individual companies.
Metric detail view in aggregated mode
When you click a Metric while viewing multiple companies, the detail view includes:
- a completeness overview (who submitted vs who has no data yet), and
- a breakdown of the actual values for companies that have already submitted.