Data Collection
The data collection phase gathers input from your stakeholders to assess which ESG topics are material to your organization. Karomia supports three data collection methods — surveys, interviews, and focus groups — each offering different strengths. A centralized platform manages input from all stakeholders simultaneously.
Data collection methods
Choose the methods that best suit your stakeholder groups and assessment needs:
| Method | Duration | Best for | Key characteristics |
|---|---|---|---|
| Surveys | 15-30 min per respondent | Efficient data collection at scale | Quantifiable results, statistical analysis, broad reach. Respondents complete at their own pace. |
| Interviews | ~1 hour per session (~40 questions) | In-depth qualitative insights | One-on-one conversations, detailed scoring on each dimension, rich qualitative data. |
| Focus groups | ~90 minutes per session (~40 questions) | Broader understanding through group discussion | Consensus-driven approach, printed score cards for participants, higher weight in final calculations. |
Representative sample sizes
When planning survey distribution, consider what constitutes a representative sample. For example, an organization with 500 employees would need approximately 61 survey responses to achieve a statistically representative sample. Karomia calculates recommended sample sizes for each stakeholder group.
Stakeholder surveys
Surveys are the primary data collection method. They are designed to be accessible and can be completed by stakeholders without prior sustainability expertise.
Designing a survey
- Navigate to your assessment's Data Collection section.
- Click to create a new survey.
- Configure the survey settings:
| Setting | Description |
|---|---|
| Survey name | A descriptive name for this survey (e.g., "Employee Survey Q1 2025"). |
| Introduction text | A custom introduction message explaining the purpose and context of the survey to respondents. |
| Max questions per respondent | The maximum number of scoring questions each respondent will answer. Recommended: 15 or fewer for internal stakeholders, 10 or fewer for external stakeholders. |
| Logo | Upload your organization's logo to brand the survey experience. |
| Video | (Optional) Add an introductory video to provide additional context to respondents. |
Survey flow for respondents
Every survey follows a structured 7-step flow. For a detailed walkthrough from the respondent's perspective, see the Survey Respondent Guide.
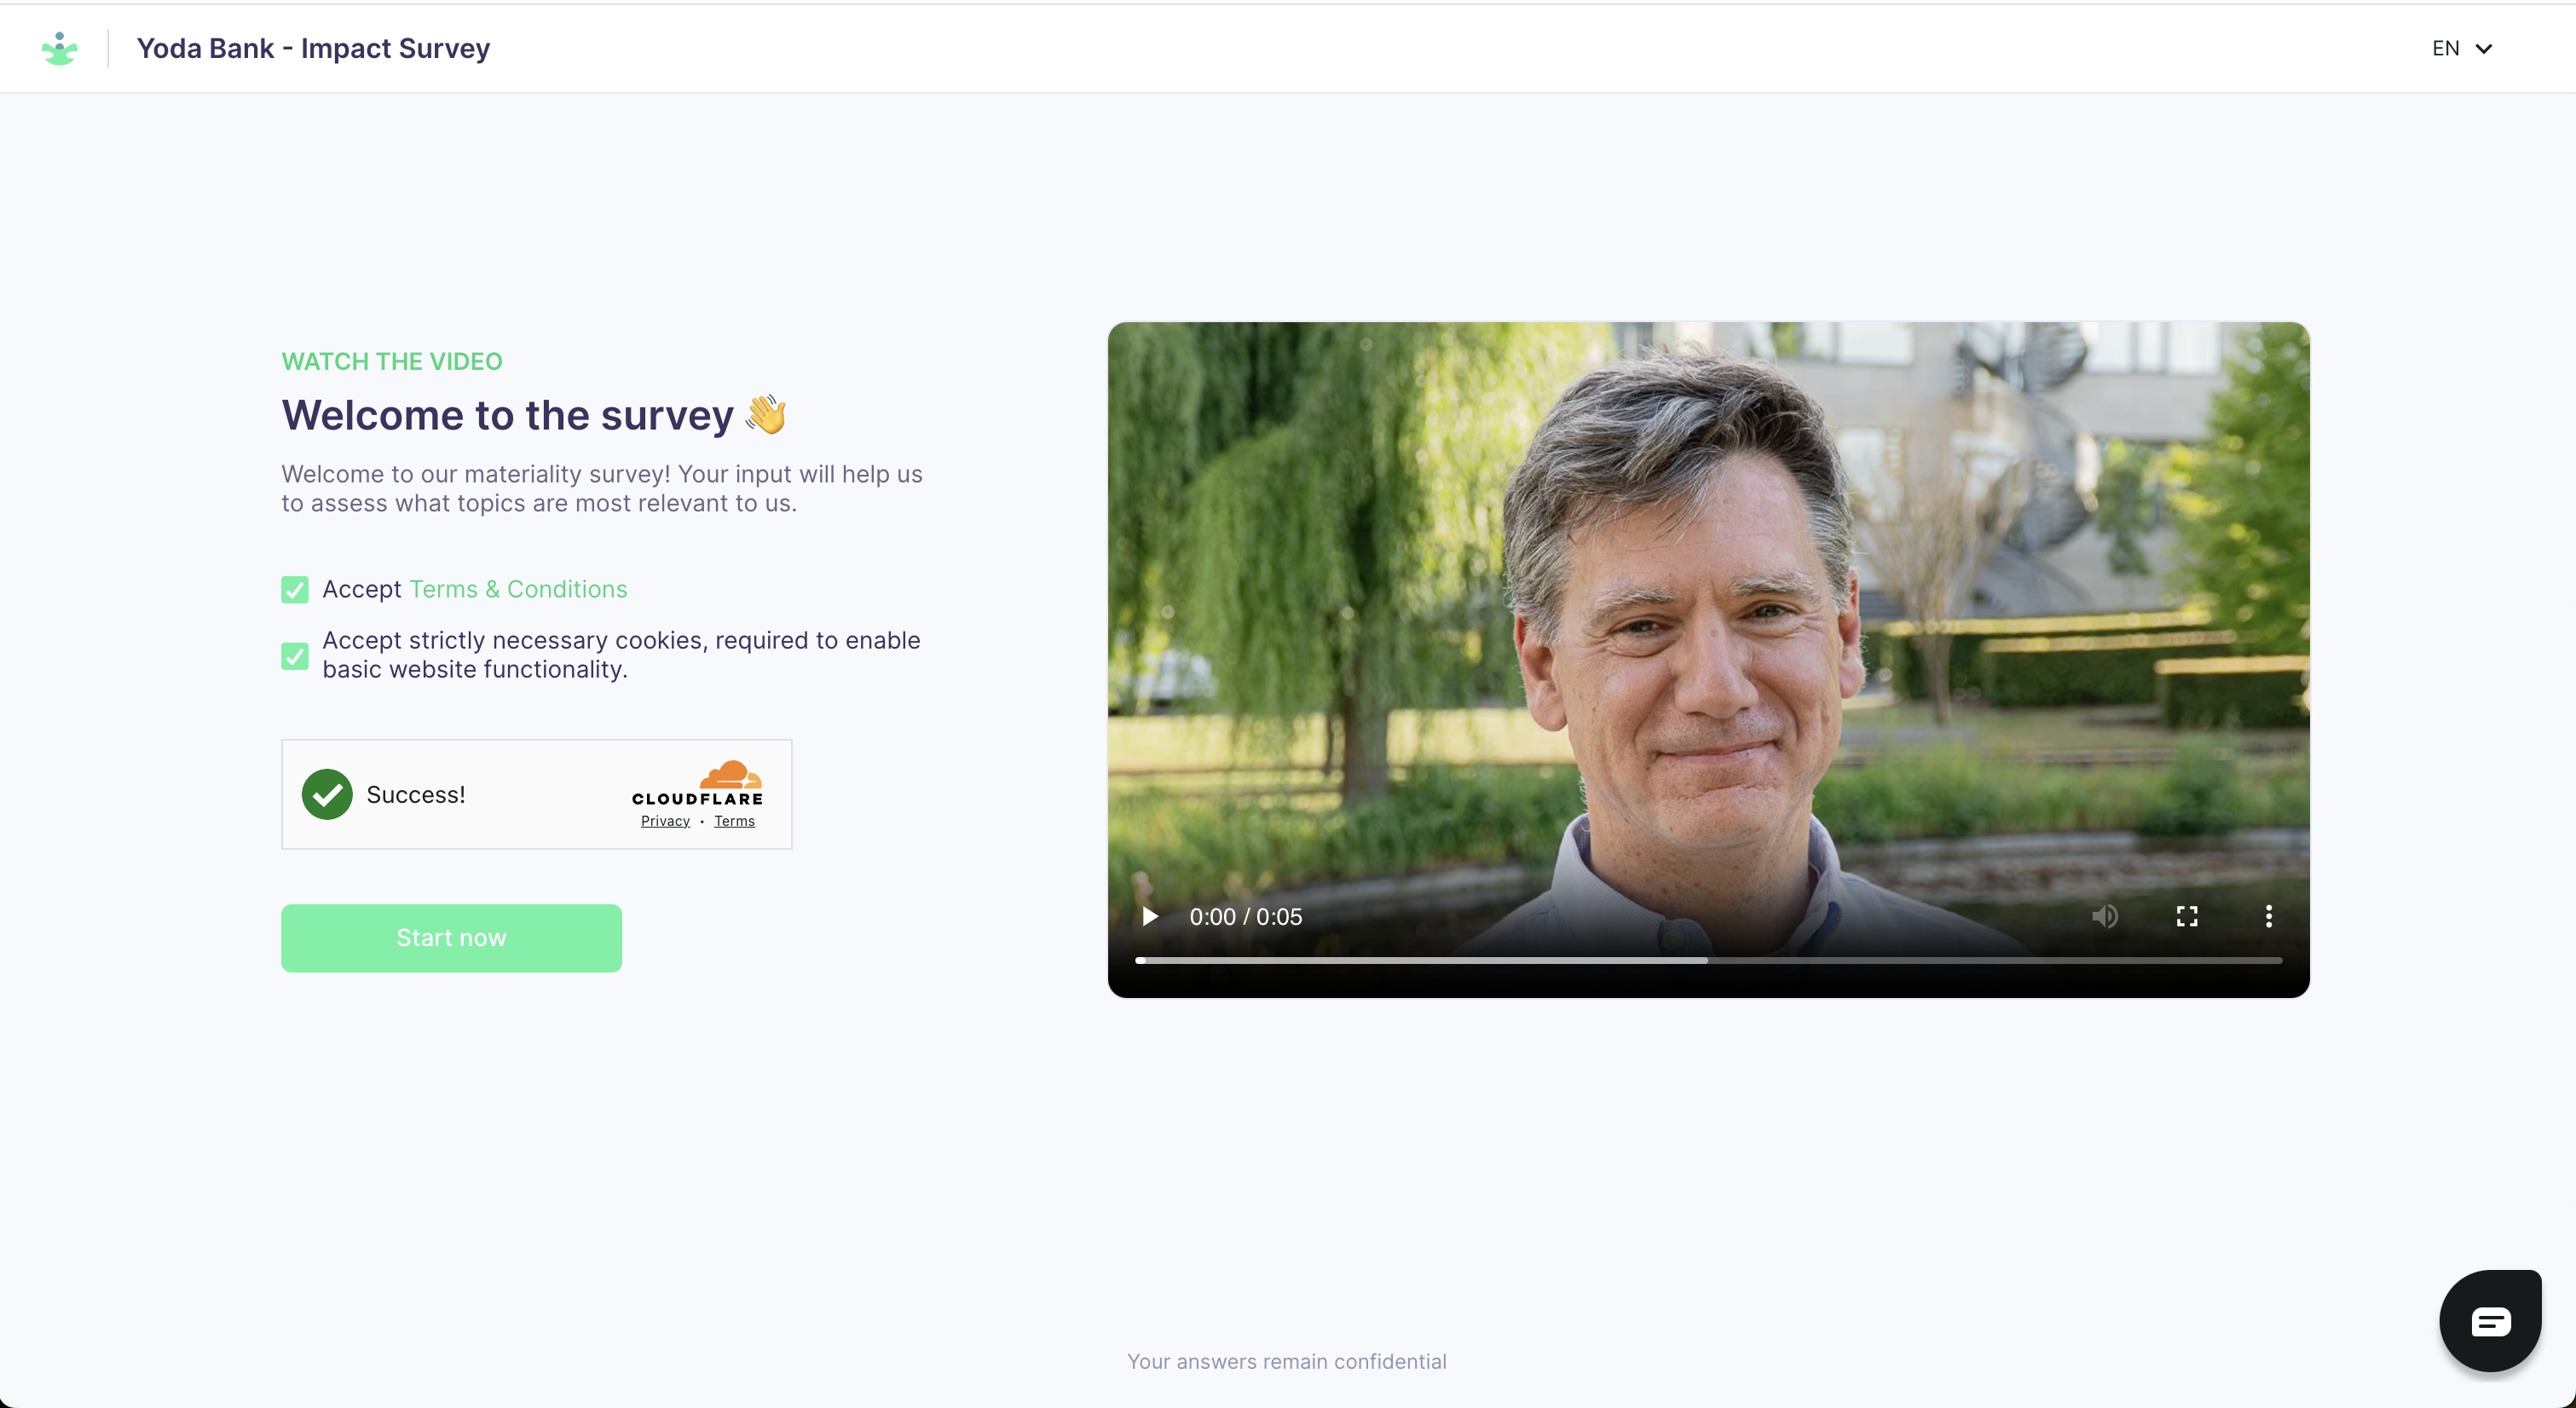
Step 1: Introduction The respondent sees a welcome message with context about the assessment, accepts the terms of participation, and completes a Cloudflare verification.
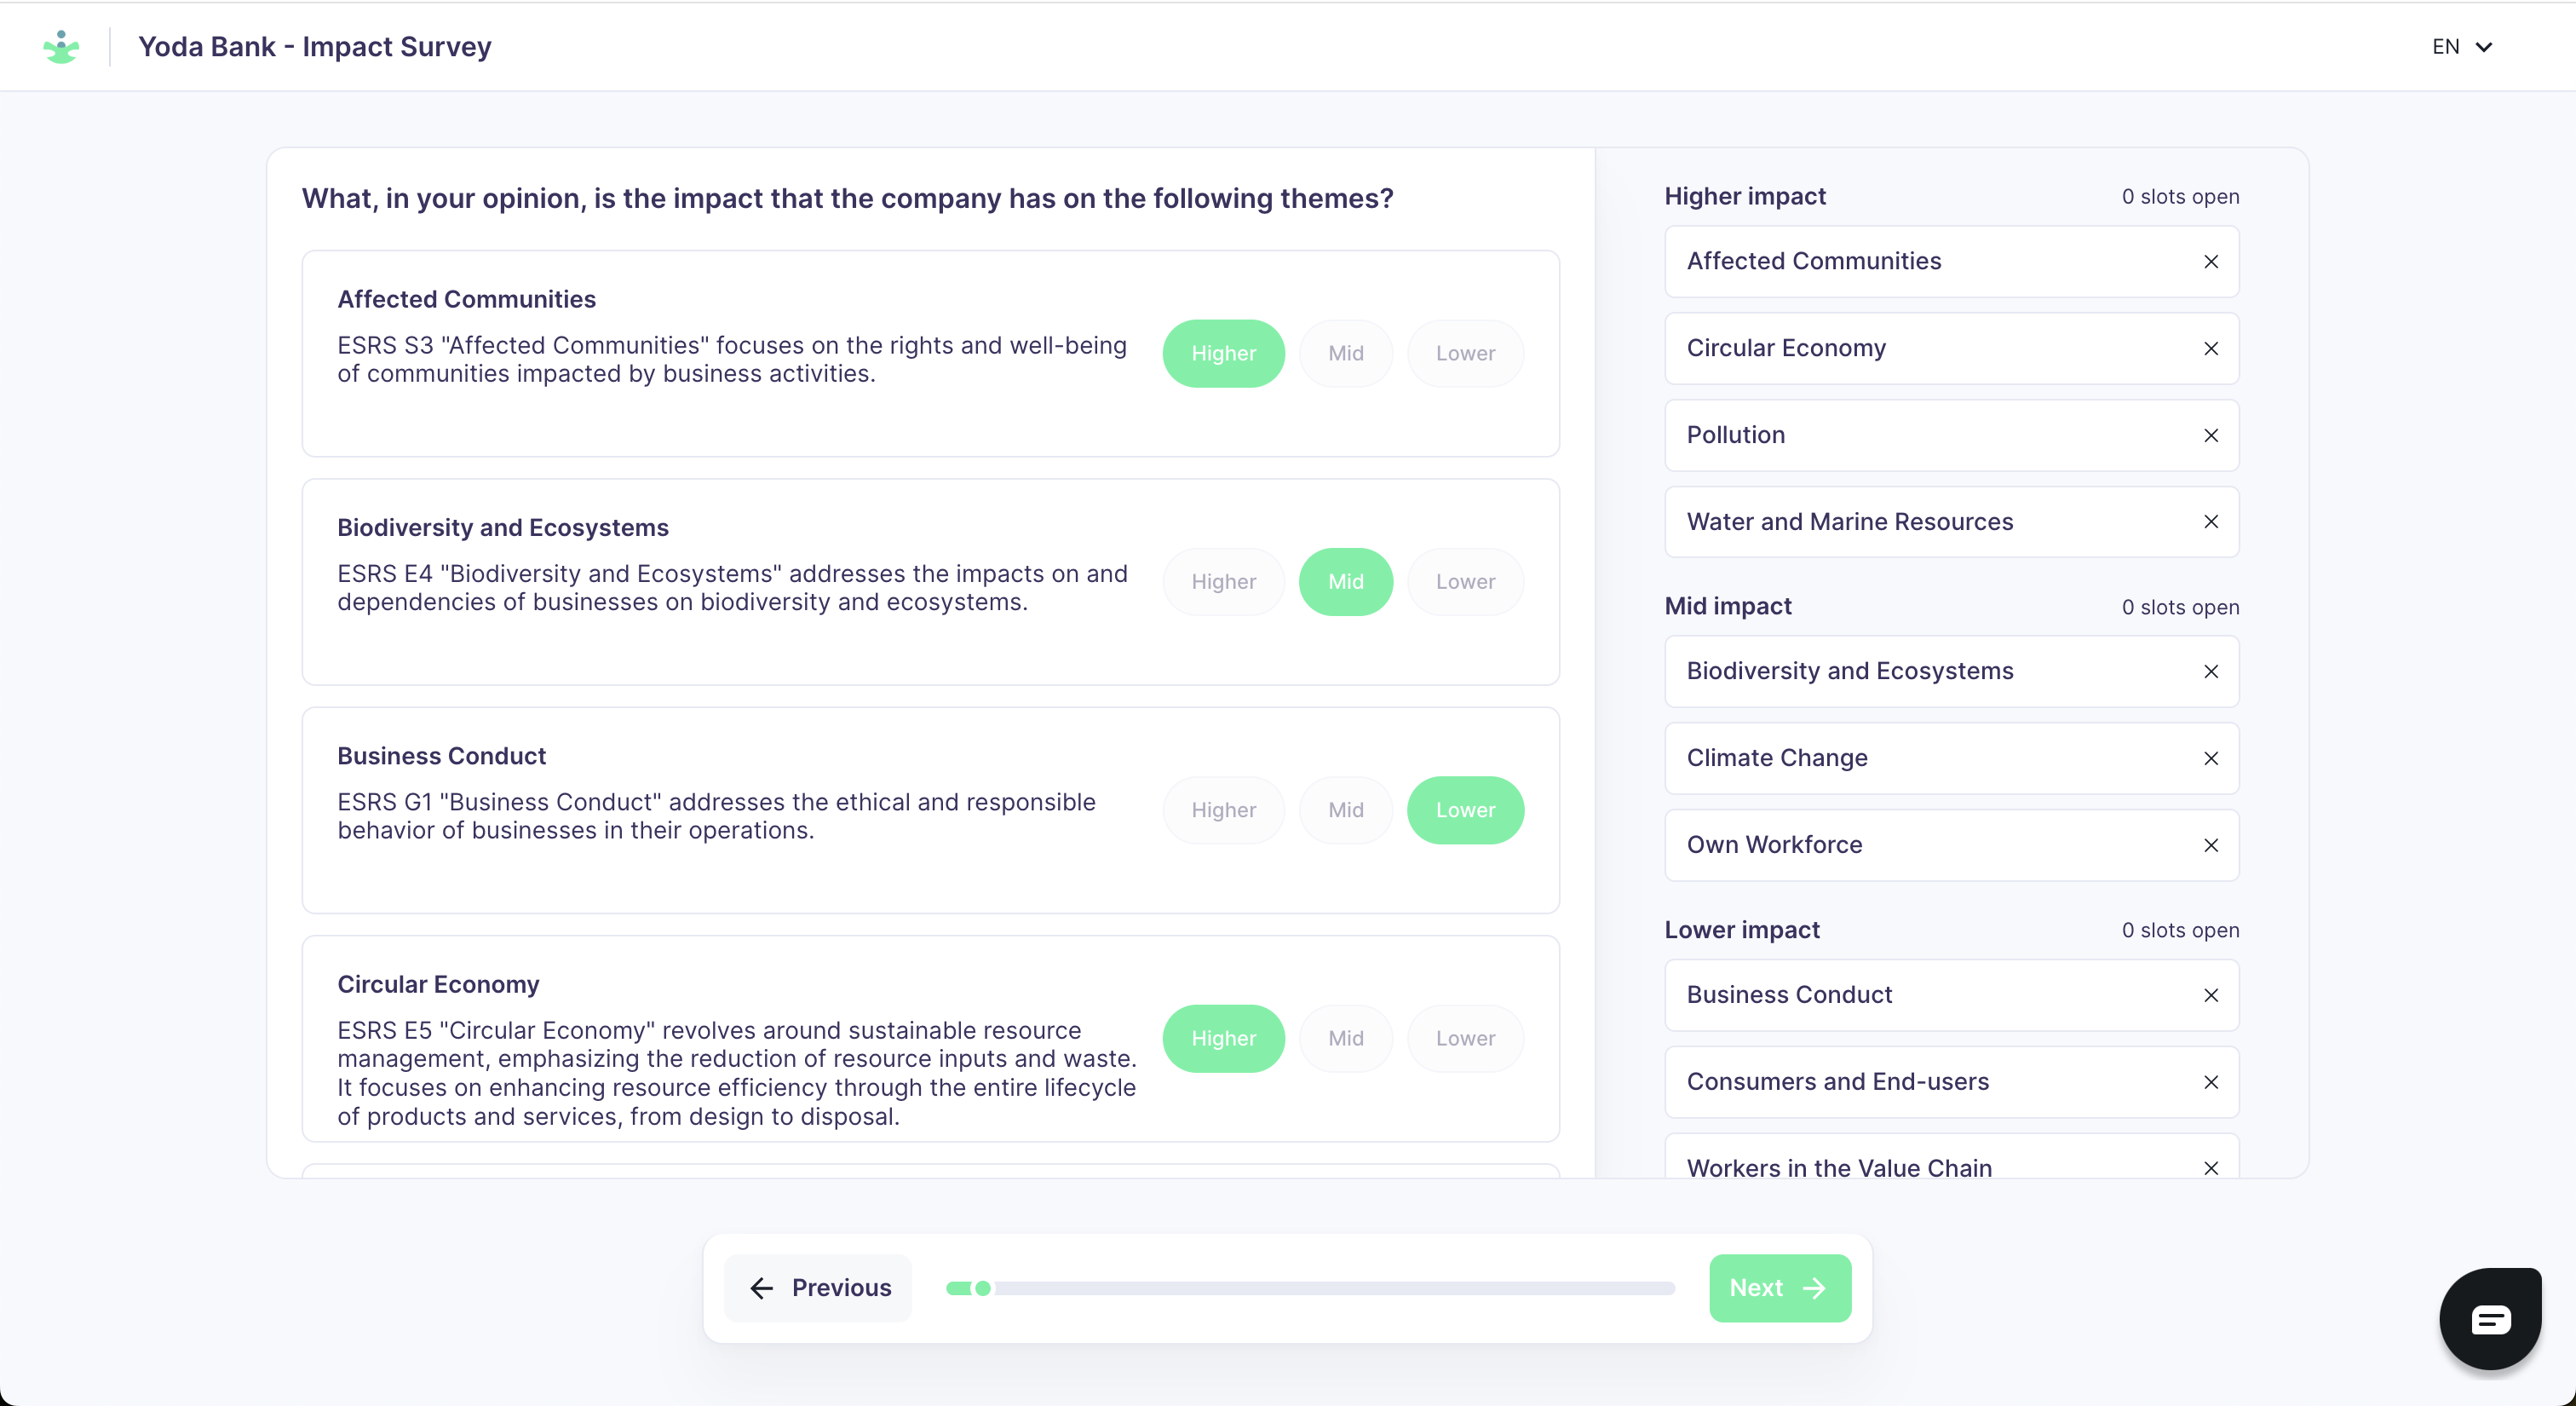
Step 2: Topic ranking The respondent categorizes each ESRS topic into one of three relevance tiers:
- Higher relevance — Topics the respondent considers most significant.
- Mid relevance — Topics with moderate significance.
- Lower relevance — Topics with less significance to the respondent.
Step 3: Expertise questions For the top 4 ranked topics, the respondent indicates their level of expertise. This expertise level is used to weight their responses in the final calculation.
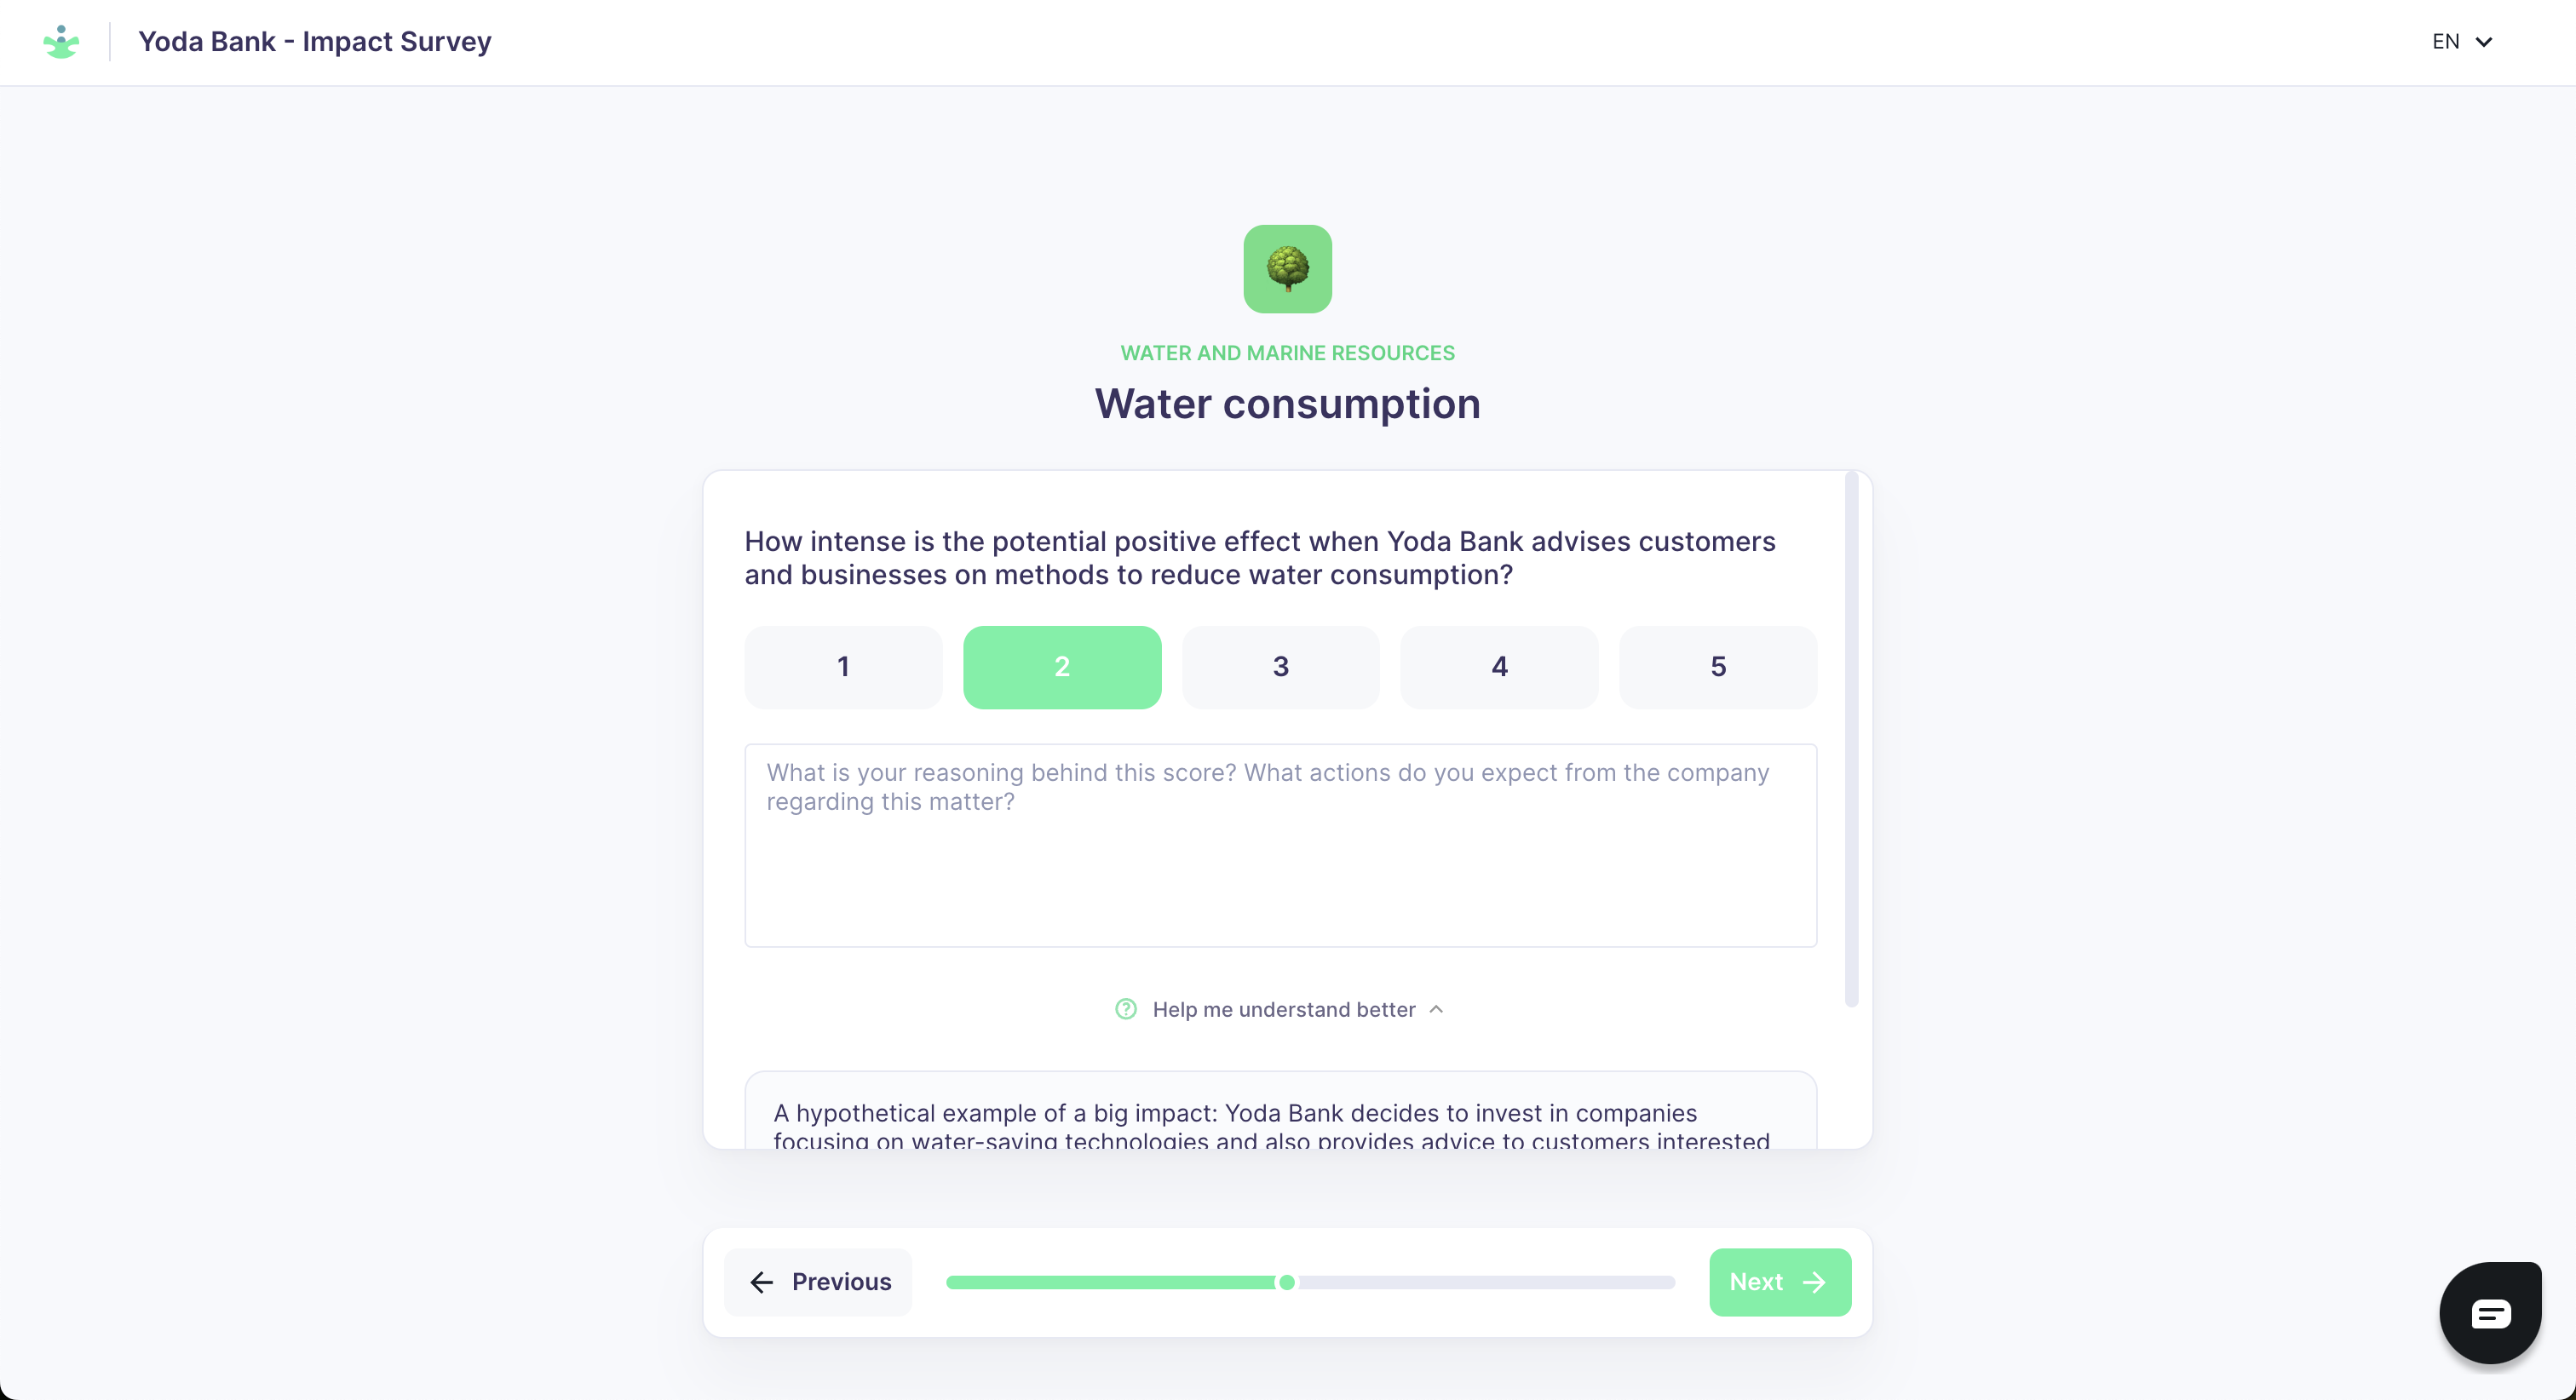
Step 4: Scoring The respondent scores individual IROs (Impacts, Risks, and Opportunities) on a scale of 1 to 5. An "I don't have an answer" option is always available. After scoring, respondents can provide qualitative insights to explain their reasoning.
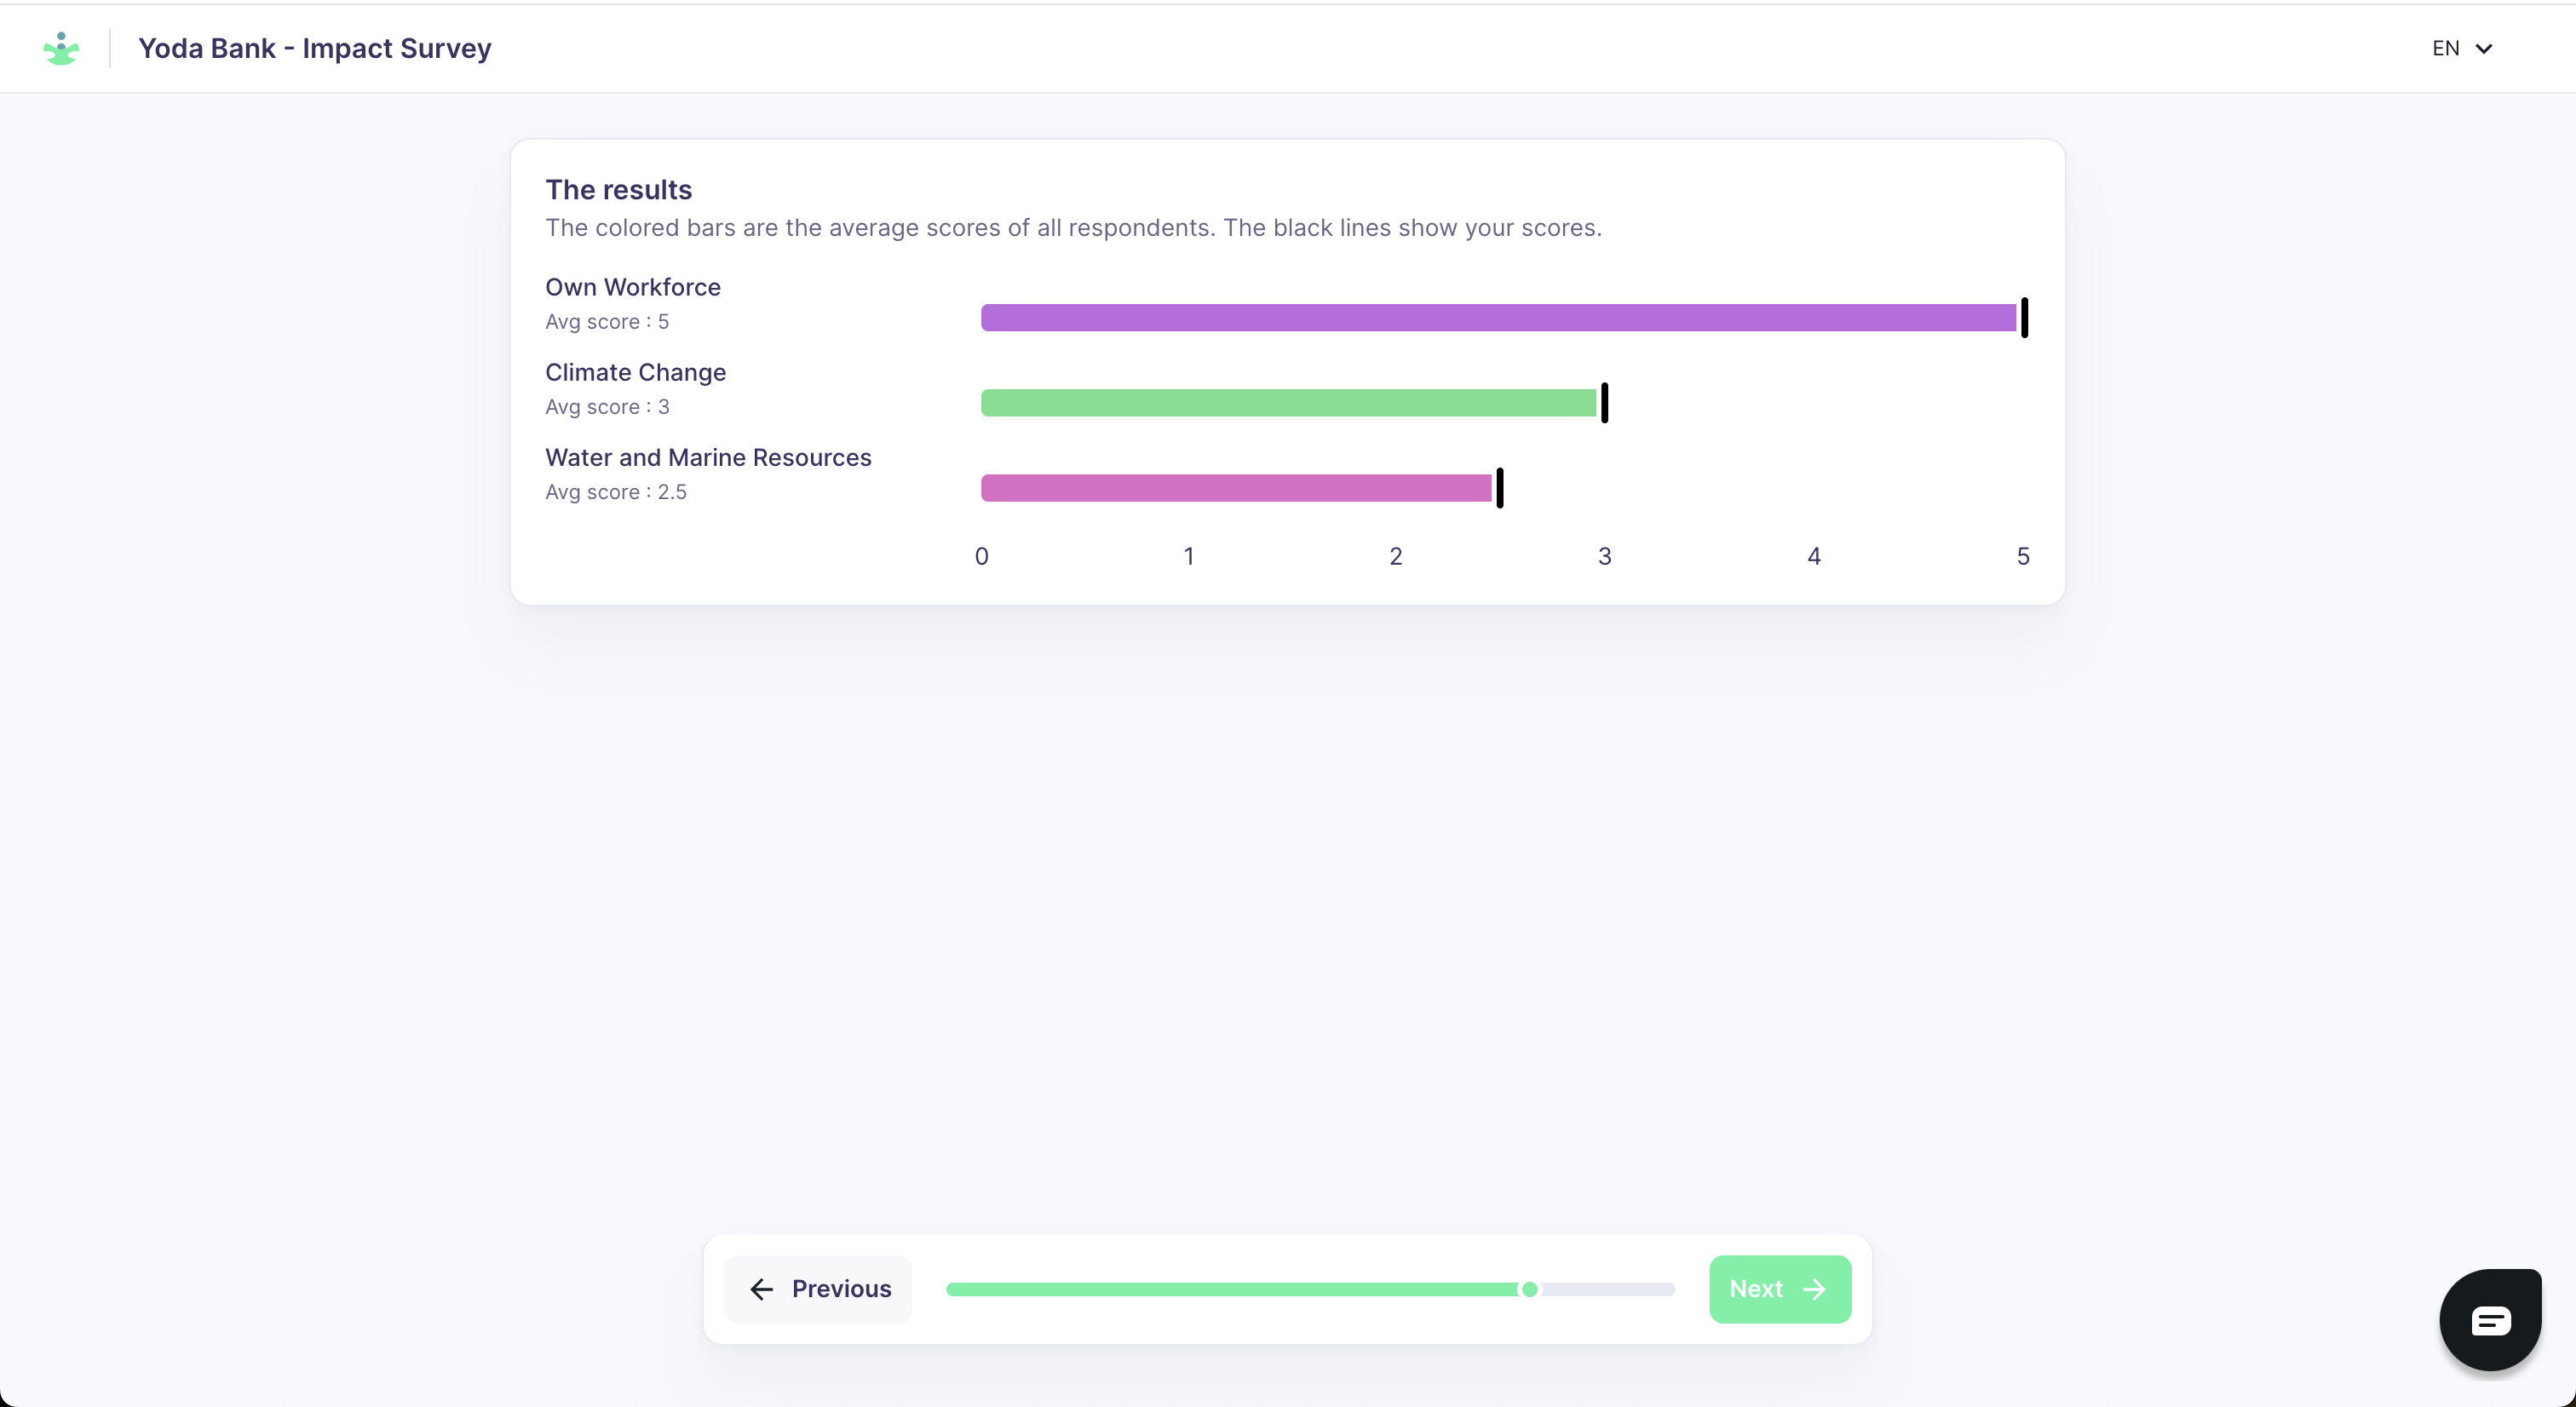
Step 5: Results summary The respondent sees a summary of their responses, broken down by topic and in aggregate.
Step 6: Email collection Respondents can optionally provide their email address. This is never linked to their individual answers and is used only for follow-up communication. Surveys can be fully anonymous.
Step 7: Thank you A closing page thanking the respondent for their participation.
Dynamic question selection
When the maximum number of questions per respondent is set lower than the total number of available questions, Karomia uses a dynamic selection algorithm. Questions are assigned based on:
- The respondent's topic ranking (higher-ranked topics are prioritized).
- The respondent's expertise level (experts receive more nuanced questions).
- The existing response count per question (questions with fewer responses are prioritized to ensure balanced coverage).
This ensures that every question receives sufficient responses while keeping the survey manageable for each individual respondent.
Interviews
Interviews provide in-depth qualitative data through one-on-one conversations with key stakeholders.
Conducting an interview
- Schedule the interview session (plan for approximately 1 hour to cover ~40 questions).
- Open the interview session in Karomia using the provided session URL.
- For each IRO, record the stakeholder's score across multiple dimensions:
- Scale — How widespread is the impact?
- Scope — How deep or significant is the impact?
- Irremediability — How difficult is it to reverse or remediate the impact?
- Likelihood — How probable is the risk or opportunity?
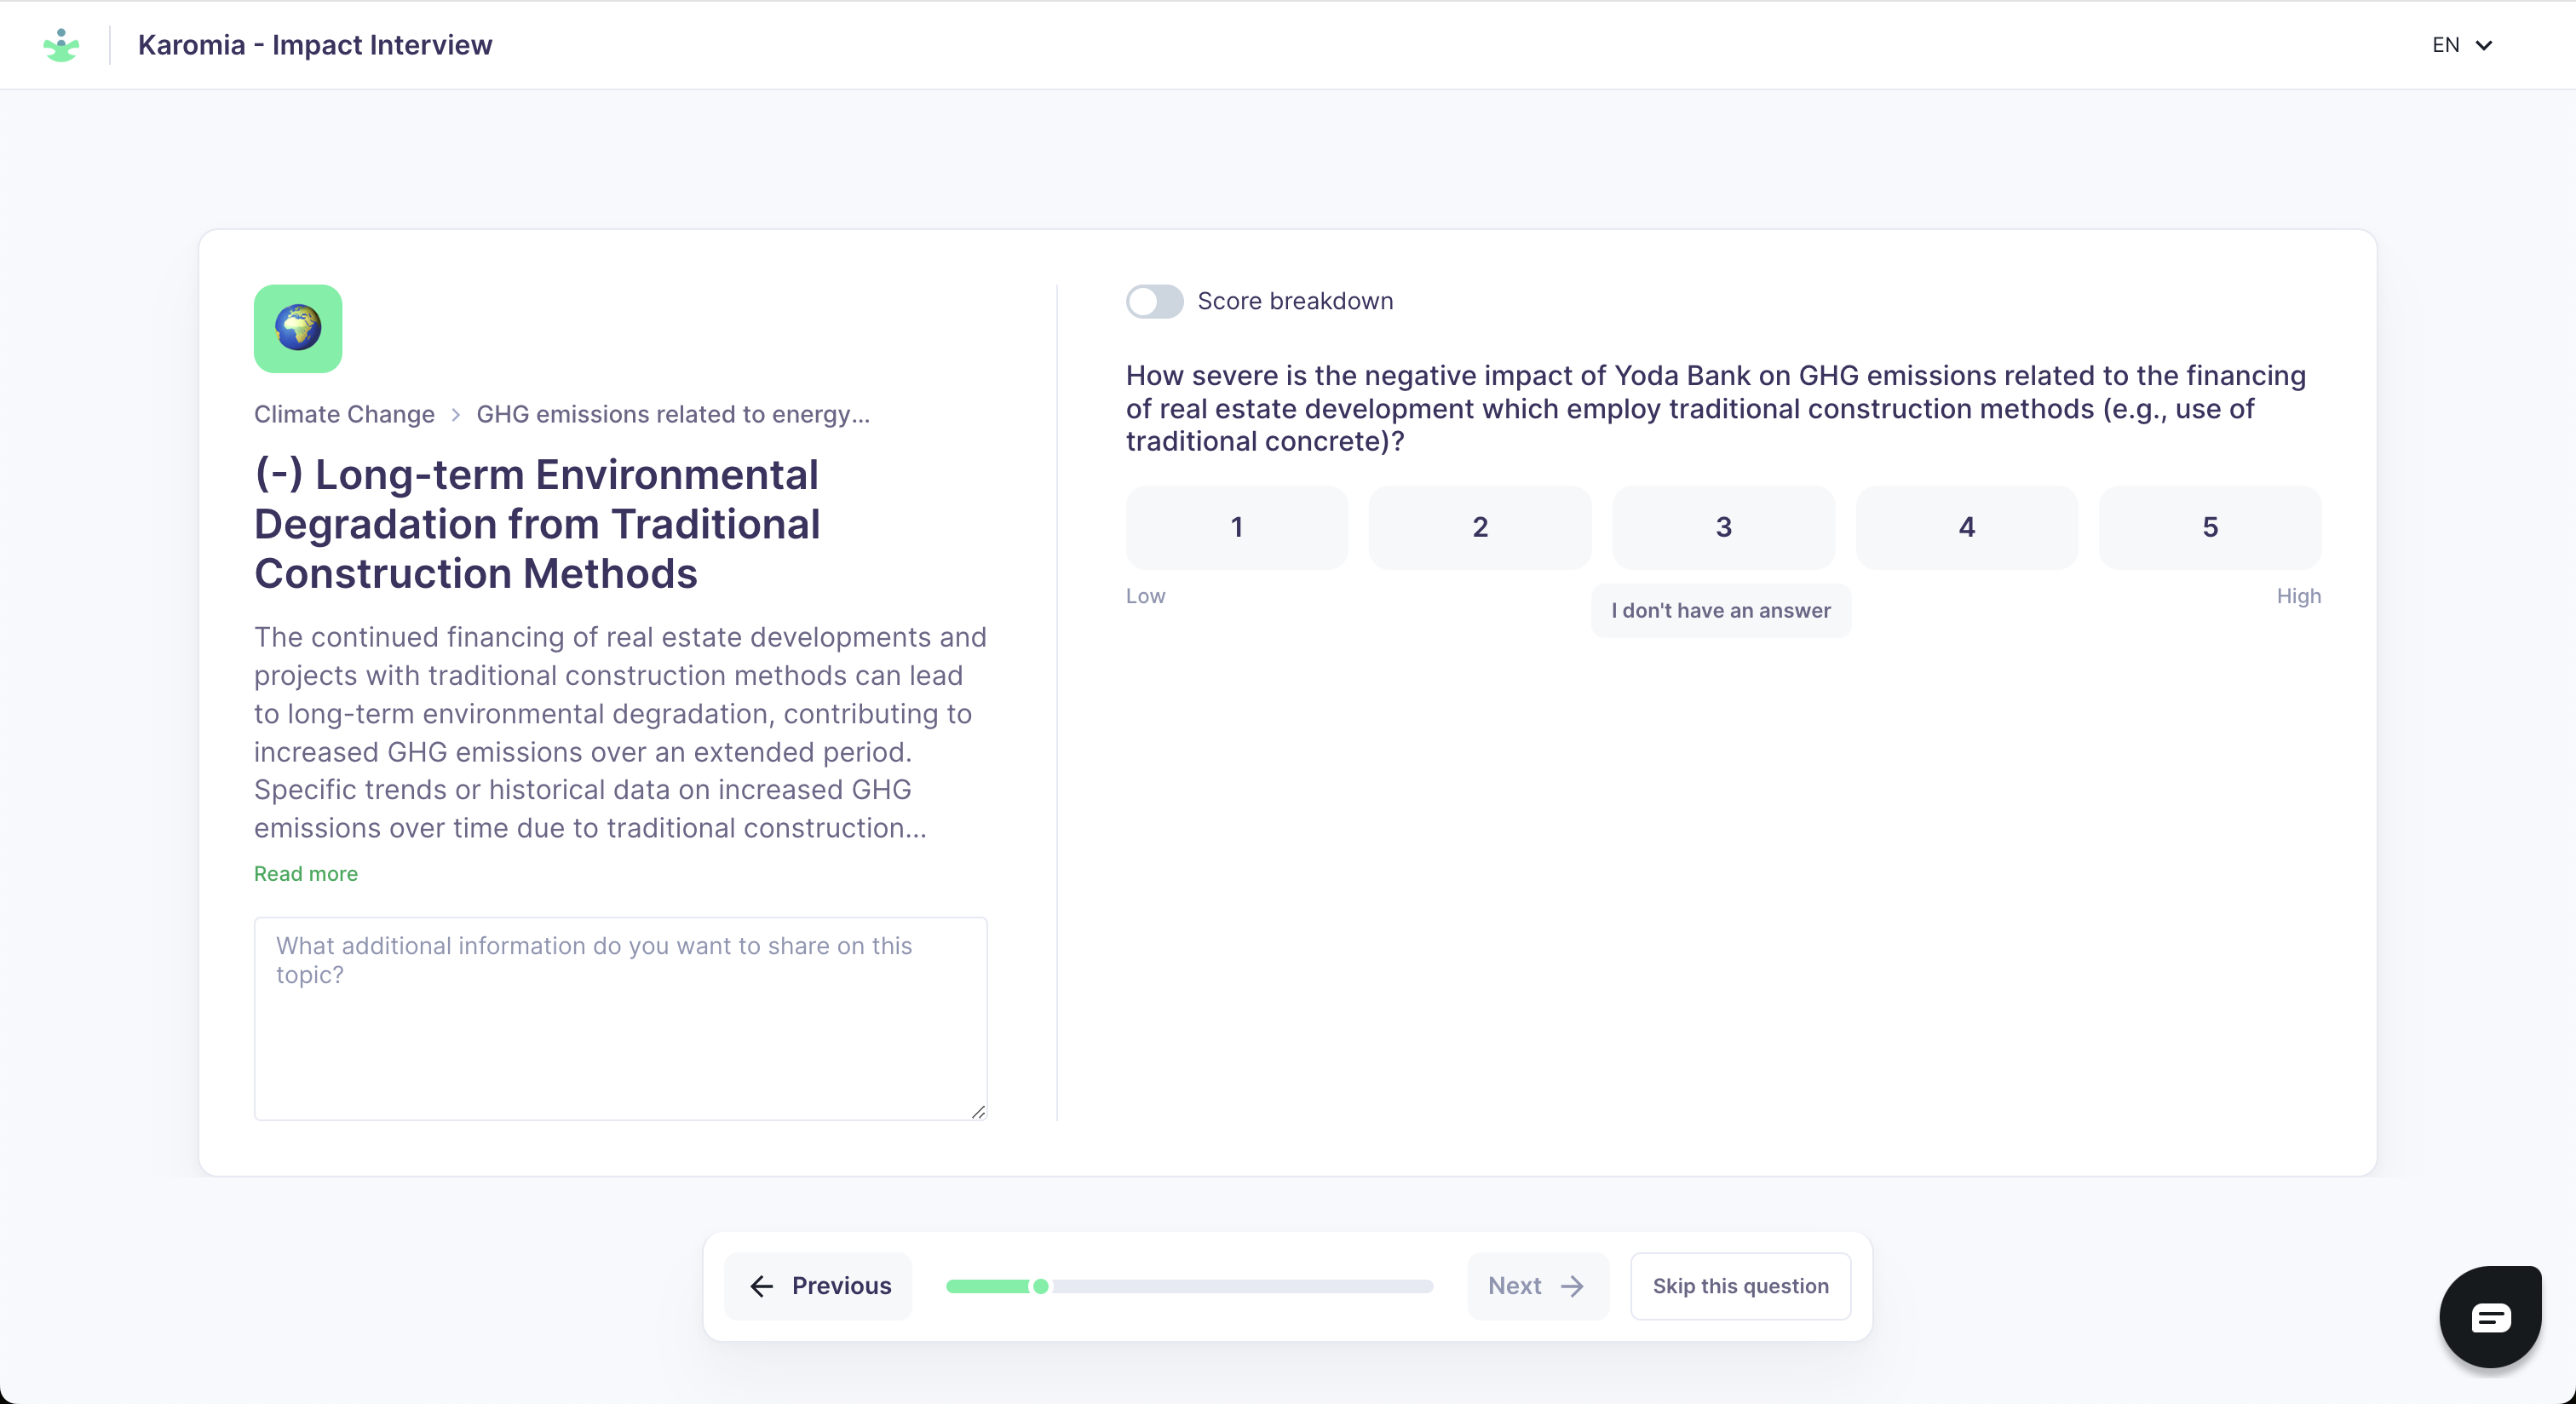
Interviews carry a higher weight than surveys in the final materiality calculation (3x the weight of a survey response). Use interviews for stakeholders whose expertise or perspective is particularly important to the assessment.
Focus groups
Focus groups bring multiple stakeholders together for facilitated discussions, producing consensus-driven results.
Conducting a focus group
- Schedule the session (plan for approximately 90 minutes to cover ~40 questions).
- Print score cards for each participant — these are used during the session for individual scoring before group discussion.
- Open the focus group session in Karomia.
- Facilitate discussion on each IRO, then record the group's consensus scores.
Focus groups carry the highest weight in the final calculation (6x the weight of a survey response). The participant count for the focus group is used as the expertise weight in the calculation. This makes focus groups particularly influential in determining materiality outcomes.
Communication assets
Karomia provides communication assets to help you engage stakeholders:
- Informational materials explaining the purpose of the DMA.
- Templates for stakeholder outreach.
- QR codes for easy survey access.
Monitoring progress
Track data collection progress through the Data Collection Summary view:
- See response rates per stakeholder group.
- Identify groups that need follow-up.
- Review preliminary results as responses come in.
For more details on survey distribution and management, see the Surveys section.
Next steps
- IRO analysis — Analyze the collected data.